Question 728015: How do you graph the function g(x)=|x+1| ?
Found 2 solutions by stanbon, fcabanski:
Answer by stanbon(75887)   (Show Source): (Show Source):
You can put this solution on YOUR website! graph the function g(x)=|x+1| ?
-----
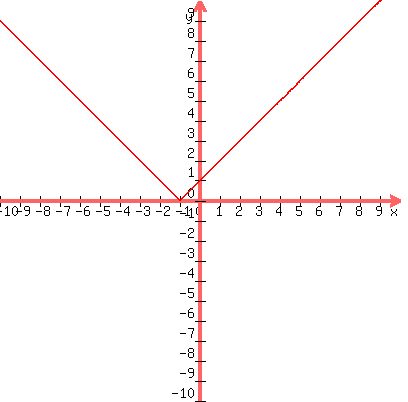
Graphin ALWAYS comes down to plotting points.
If x = -3, y = |-2| = 2 gives (-3,2)
----
If x = -2, y = |-1| = 1 gives (-2,1)
----
If x = -1, y = |0| = 0 gives (-1,0)
etc.
-------------
cheers,
Stan H.
Answer by fcabanski(1391) (Show Source): (Show Source):
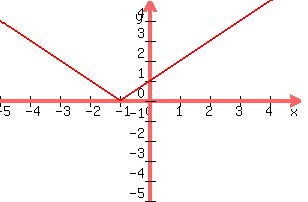
You can put this solution on YOUR website! The graph of g(x) = |x| is two straight lines starting at y=0: When x=0 y=0, when x = -1 or 1 y=1, when x=2, y=2.
The -1 inside the | | shifts the graph one to the left. You can make a table of some values to see that.
When x=-1 |x+1| = |-1 + 1| = 0 so y=0.
When x=0, y=1
when x=1, y=2
When x=-2, y=1
|
|
|