|
Question 679313: I need to graph y < 1/2X + 1 and make an xy table, I am confused...
Answer by ReadingBoosters(3246)   (Show Source): (Show Source):
You can put this solution on YOUR website! 
...
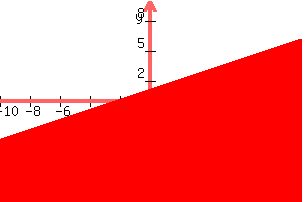
Start with intercepts
y intercept, b, is 1 : Plot (0,1)
...
x intercept is where y = 0
0 = 
-1 =  x x
2(-1) = x
x = -2 : Plot (-2,0)
...
So far the table is
x | y
0 | 1
-2 | 0
...
choose any arbitary number for x and solve for y
y =
...
If x is 2, y = (2) + 1 = 1 + 1 = 2
Plot (2,2)
...
If x is 4, y = (4) + 1 = 2+1 = 3
Plot (4,3)
...
and so on
...
When you draw the line, draw a DASHED line, so as to NOT include the points on the line.
Shade the area below the line since the inequality says y is <, less than.
...
.....................
Delighted to help; feel free to email if you have further questions.
HomeworkHelpers@readingboosters.com
-Reading Boosters
Website: www.MyHomeworkAnswers.com
Wanting for others what we want for ourselves.
|
|
|
| |