How can I solve the following system of linear inequalities by graphing.
3x – y < 2
x + y > 2
First form the equations of the boundary lines, graphing one at a
time. To form them replace the inequalities by = signs
3x – y = 2
x + y = 2
Graph the first one by getting two points, say, (0, -2) and (2, 4)
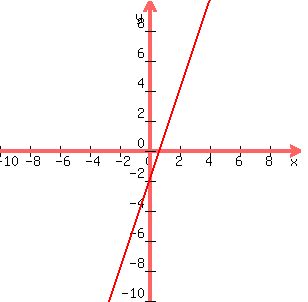 That line should be a dotted line, not a solid line,
since it's " < " and not " < ", but I can't do that on here,
but you can on your paper.
Now before graphing the second one, pick any arbirtary point
that you are sure is not on that line as a test point.
Say we pick (x,y) = (-2,4) and substitute that in the
first original inequality to see whether it is true or false
3x – y < 2
3(-2) - 4 < 2
-6 - 4 < 2
-10 < 2
This is true so the part we will shade has got to be on the
SAME side of that line as the test point we chose, (-2,4).
Since (-2,4) is above and to the left of the line, the region
we will shade will be above and to the left of that line
Now graph the second bondary line by getting two points, say,
(0, 2) and (2, 0). Graph it on the same set of axes:
That line should be a dotted line, not a solid line,
since it's " < " and not " < ", but I can't do that on here,
but you can on your paper.
Now before graphing the second one, pick any arbirtary point
that you are sure is not on that line as a test point.
Say we pick (x,y) = (-2,4) and substitute that in the
first original inequality to see whether it is true or false
3x – y < 2
3(-2) - 4 < 2
-6 - 4 < 2
-10 < 2
This is true so the part we will shade has got to be on the
SAME side of that line as the test point we chose, (-2,4).
Since (-2,4) is above and to the left of the line, the region
we will shade will be above and to the left of that line
Now graph the second bondary line by getting two points, say,
(0, 2) and (2, 0). Graph it on the same set of axes:
 That one should be dotted too, since it's " > " and not " > "
Now pick any arbirtary point that you are sure is not on that
line as a test point.
Say we pick (x,y) = (-6,2) and substitute that in the
second original inequality to see whether it is true or false
x + y > 2
-2 + 2 > 2
0 > 2
0 > 2
This is false so the region we will shade has got to be on the
OPPOSITE side of that line as the test point we chose, (-6,2).
Since (-6,2) is below and to the left of the second line, the
region we will shade will be above and to the right of that line.
So the region we will shade is the upper V-shaped wedge which
is above and to the left of the red line and above and to the
left of the green line.
I can't shade on here but you can on your paper, and remember
to draw both lines dotted.
Edwin
That one should be dotted too, since it's " > " and not " > "
Now pick any arbirtary point that you are sure is not on that
line as a test point.
Say we pick (x,y) = (-6,2) and substitute that in the
second original inequality to see whether it is true or false
x + y > 2
-2 + 2 > 2
0 > 2
0 > 2
This is false so the region we will shade has got to be on the
OPPOSITE side of that line as the test point we chose, (-6,2).
Since (-6,2) is below and to the left of the second line, the
region we will shade will be above and to the right of that line.
So the region we will shade is the upper V-shaped wedge which
is above and to the left of the red line and above and to the
left of the green line.
I can't shade on here but you can on your paper, and remember
to draw both lines dotted.
Edwin

