Question 60204: Could someone help me graph the follwing and show me what the graph looks like?
y = x + 2
Thank you,
Lyn
Answer by funmath(2933)   (Show Source): (Show Source):
You can put this solution on YOUR website! Hi Lyn,
I've showed you the method of plotting points, the intercept method, and now I'm going to show you the slope-intercept method. Pick a method you like:
:
Graph the follwing and show me what the graph looks like.
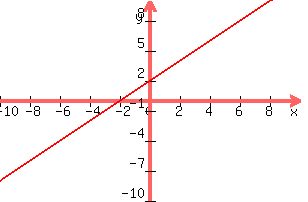
y = x + 2
This is in slope intercept form:  , m=slope=rise/run, and (0,b) is the y-intercept. , m=slope=rise/run, and (0,b) is the y-intercept.
 the y-intercept is (0,2) Plot (0,2) the y-intercept is (0,2) Plot (0,2)
From that point, use the slope:
 , m=1/1 (if you don't see a coefficient of x), go up one, and right 1 and plot a second point at what should be (1,3). , m=1/1 (if you don't see a coefficient of x), go up one, and right 1 and plot a second point at what should be (1,3).
Connect the points and you have this line:
Happy Calculating, Lyn!!!
|
|
|