|
Question 1171790: A certain dosage of radiation, measured in kilorads, must be given to the
tumor near the brain. The dose delivered must be sufficient to kill the malignant cells but the aggregate dose must not exceed established tolerance levels for the brain. Two beams which would deliver radiation exposure to the cells will be used. The goal is to select certain beam durations that would generate the best dosage distribution by minimizing the radiation absorbed by the brain. The data for the radiation therapy is given below:
                Fraction of dose absorbed per second       Average dosage
   Area                   Beam 1          Beam 2            (in kilorads)
   Brain                    0.4             0.5
   Spine                    0.3             0.1              At most 2.7
   Tumor                    0.5             0.5              At most 6
   Center of Tumor          0.6             0.4              At least 6
Determine the optimal exposure times for beam 1 and beam 2.
Answer by Theo(13342)   (Show Source): (Show Source):
You can put this solution on YOUR website! the dose that will minimize the amount of radiation absorbed by the brain is shown in the following table.
		min	<=2.7	<=6	>=6
x	y	brain	spine	tumor	center
6	6	5.4	2.4	6	6
7.4	4.5	5.21	2.67	5.95	6.24
8	3	4.7	2.7	5.5	6
i believe the answer is 8 seconds from beam 1 and 3 seconds from beam 2.
that provides the minimum dose of radiationon your brain.
if your want your table to look like a table, then use the pre and /pre html tags.
these tags are preceded by a < and followed by a >.
that's how html recognizes them as tags.
i used them on your table and also used them on the table i showed you.
anything between these tags is shown exactly the way you typed them, with multiple spaces, tab spacing, etc.
i use spaces rather than tabs because i find it easier to control the spaces between columns, although you might be able to get away with tabs as well.
it works pretty good once you get the hang of it.
apparently, algebra.com text follows html rules, so you can do other things if you're familiar with html.
i used the desmos.com calculator to graph your problem, since it looks like the graphical approach is applicable.
x represents the number of seconds from beam 1.
y represents the number of seconds from beam 2.
the objective function is .4 * x + .5 * y.
this is the function you want to minimize.
it is the function you will analyze at each of the corner points in the region of feasibility on the graph.
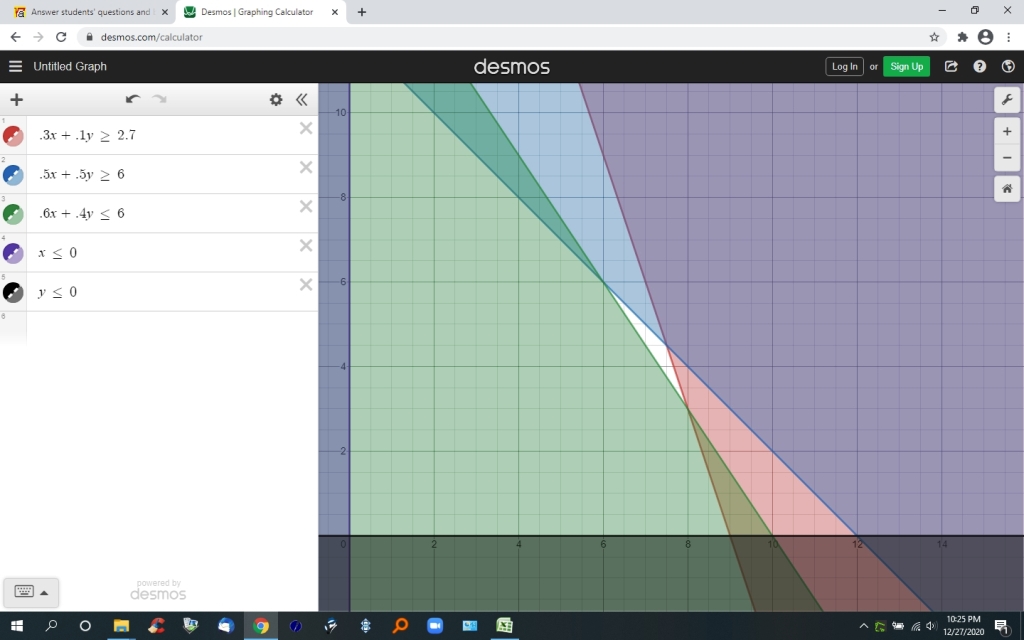
using the desmos.com calculator, you graph the opposite of the constraint functions.
your constraint functions are:
.3x + .1y <= 2.7
.5x + .5y <= 6
.6x + .4y >= 6
x >= 0
y >= 0
you will graph the opposite of the inequalities.
specifically, you will graph:
.3x + .1y >= 2.7
.5x + .5y >= 6
.6x + .4y <= 6
x <= 0
y <= 0
the far out view of the graph is shown below.
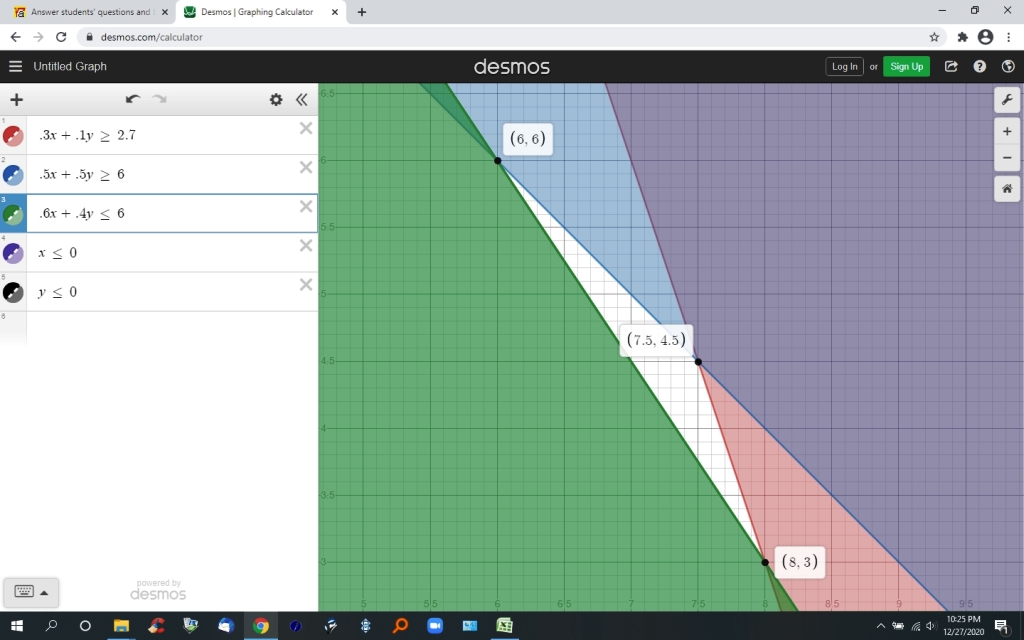
the near in view of the graph is shown below.
this graph shows the (x,y) values at the corner points of the feasible region.
the feasible region is the unshaded portion of the graph.
the desmos.com calculator can be found at https://www.desmos.com/calculator
i'll be available to answer any questions you might have about this.
theo
|
|
|
| |