|
Question 116283: Can you help me with these questions? I did not get this out of a book, it was a handout. The question is: Find the x and y intercepts and then graph
x-y=2 , -x+4y=4 and y = -4x -4. I do not fully understand the question.
Any help on this is greatly appreciated. Can you explain it step by step, not leaving anything out , please.
Thankyou
Laurie
Found 2 solutions by ankor@dixie-net.com, bucky:
Answer by ankor@dixie-net.com(22740)   (Show Source): (Show Source):
You can put this solution on YOUR website! :
I will try to be very detailed on the 1st one, hopefully by the time you get to the 2nd one you will have an idea what's going on.
:
Find the x and y intercepts and then graph
:
x - y = 2
First we want to put the equation in the "y ="; subtract x from both sides:
-y = -x - 2
y has to be positive in this form, multiply equation by -1 and you have:
y = x + 2
:
The x intercept occurs when y = 0, therefore make y = 0 and solve for x:
x + 2 = y
x + 2 = 0
x = -2; this is the x intercept
:
The y intercept occurs when x = 0; substitute 0 for x in our equation, find y:
y = x + 2
y = 0 + 2
y = +2; this is the y intercept
:
To graph this we need at least two x,y points, choose convenient values for x:
let x = -3 and let x = +3
:
Substitute -3 for x:
y = x + 2
y = -3 + 2
y = -1
Plot x=-3, y=-1 on a standard +/-10 graph
:
2nd point: x = +3
y = x + 2
y = 3 + 2
y = +5
Plot x=3, y=5 on the same graph, join points with a straight line, this is the graph
:
Should look like this
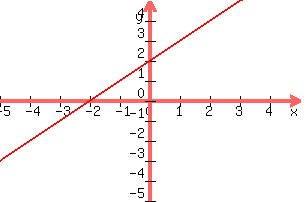
Note that it confirms are values for the x and y intercepts
The graph crosses the vertical line where y=2, (the y intercept)
The graph crossed the horizontal line where x = -2; (the x intercept)
:
:
-x + 4y = 4
Put equation into the y= form, add x to both sides
4y = x + 4
y has to have a coefficient of 1, divide both sides by 4 and you have:
y =  + + 
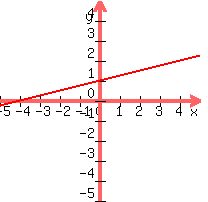
y = .25x + 1
:
The x intercept (y=0):
.25x + 1 = y
.25x + 1 = 0
.25x = -1
x has to have a coefficient of 1, multiply both sides by 4 and you have;
x = -4; is the x intercept
:
The y intercept (x=0)
y = .25x + 1
y = .25(0) = 1
y = 0 + 1
y = 1 is the y intercept
:
two x,y points, choose some convenient values for x:
let x = -3 and let x = +3
:
Substitute -3 for x:
y = .25x + 1
y = .25(-3) + 1
y = -.75 + 1
y = +.25
Plot x=-3, y=+.25
:
2nd point: x = +3
y = .25(3) + 1
y = .75 + 1
y = +1.75
Plot x=3, y=1.75 on the same graph, join points with a straight line, this is the graph.
:
Should look like this
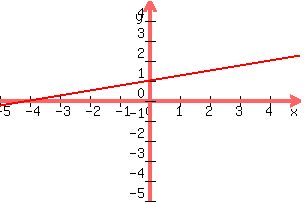
Note that it confirms are values for the x and y intercepts
The graph crosses the vertical line where y=1, (the y intercept)
The graph crossed the horizontal line where x = -4; (the x intercept)
:
:
y = -4x - 4 this one is already in the form we want it:
:
x intercept (y=0)
-4x -4 = y
-4x - 4 = 0
-4x = +4; added 4 to both sides:
x = -1; divided both sides by -4 to make the coefficient of x a +1
:
y intercept (x=0)
y = -4(0) - 4
y = -4;
:
Graph this equation the same way, it is more convenient to use x = -2 and x = +1
This is to keep the points on a +/-10 xy graph.
Substitute -2 for x:
y = -4x - 4
y = -4(-2) - 4
y = +8 - 4
y = +4
Plot x=-2, y=+4
:
2nd point: x = +1
y = -4(1) - 4
y = -4 - 4
y = -8
Plot x=1, y=-8 on the same graph, join points with a straight line,
:
Should look like this
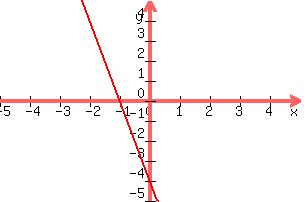
Note that it confirms are values for the x and y intercepts
The graph crosses the vertical line where y=-4, (the y intercept)
The graph crossed the horizontal line where x = -1; (the x intercept)
:
It tried to make things clear here, if you have any questions about this concept you can email me. A
:
Answer by bucky(2189)  (Show Source): (Show Source):
You can put this solution on YOUR website! Laurie ---
.
You probably can just about do these problems in your head once you understand what is going on.
.
Begin by thinking about the coordinate system of axes. A point on the y-axis must have a corresponding
x value of zero. For example, what is the coordinate pair that corresponds to the point +5
on the y-axis. The pair is (0, +5). That means that for a given linear function if you set x
equal to zero, y will equal the intercept value on the y-axis.
.
Similarly, any point on the x-axis will have zero for its y value. Example, the point (-3, 0)
is on the x-axis. So if you set y equal to zero in the given function, the corresponding
value of x will be on the x-axis.
.
Think about that until you understand the basic concept. Now let's do the problems.
.
Given: x - y = 2
.
If x is zero and you solve for y you get -y = 2 which becomes y = -2. So the point (0, -2) is
the y-intercept. Then if y is zero the function becomes x = +2. So the point (2, 0) on the x-axis
is the x-intercept.
.
You can get the graph for each of these three problems by plotting the intercepts
on the x and y axes and drawing a straight line extending through them. The graph for the
first function ... x - y = 2 ... is:
.
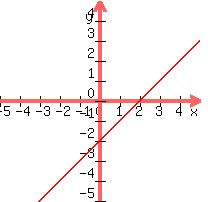
.
and this shows the intercept points that we found.
.
Next problem ... given -x + 4y = 4
.
Find the y-intercept by setting x equal to zero and you get 4y = 4. Solve for y by dividing
both sides by 4 to get y = 1. So the graph crosses the y-axis at +1.
.
Next, find the x-intercept by setting y = 0 and you get -x = 4 which becomes x = -4. So the
graph crosses the x-axis at -4. The graph of -x + 4y = 4 shows these values with the graphed
line running through them:
.
.
Final problem. Given: y = -4x -4
.
Set x equal to zero and the function becomes y = -4. So the y-intercept is -4.
.
Then set y = 0 and you get 0 = -4x - 4. Add 4 to both sides and you have 4 = -4x.
Divide both sides by -4 and you have -1 = x. So the x-intercept is at -1.
.
The graph is:
.

.
and it shows the intercepts we found.
.
Hope this helps you to understand the problems and how to solve them.
.
Bucky
|
|
|
| |