|
Question 1110198: how do you graph y=x-4
Found 2 solutions by josgarithmetic, greenestamps:
Answer by josgarithmetic(39832)   (Show Source): (Show Source):
You can put this solution on YOUR website! How to graph the line depends on what you know.
Order pair numbers (x,y) according to x and y number lines meeting at right angle...
Make a table of x & y values. If you studied more than this, then use it. Otherwise, pick an x and evaluate the y; and pick another x and evaluate that y. Do another or so if you want. Plot the points. Draw the line through them.
Answer by greenestamps(13362)  (Show Source): (Show Source):
You can put this solution on YOUR website!
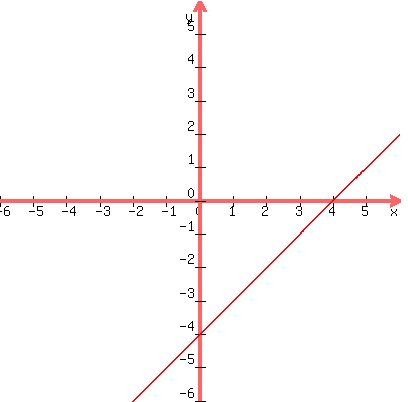
This equation is in slope-intercept form, y=ax+b, with a=1 and b = -4:

In this form, the a is the slope and the b is the y-intercept.
The intercept -- or more precisely, the y-intercept, is where the graph crosses the y-axis. Since everywhere on the y-axis the x value is 0, the y-intercept is the value of the function when x is 0:

The y-intercept is -4, or (0,-4).
So start your graph by marking the point (0,-4) on your graph.
The slope, a=1, tells you how much the graph rises (positive slope) or falls (negative slope) each time you "take one step forward" -- i.e., move 1 to the right. So a slope of 1 tells you that each time you move 1 to the right, the graph moves up 1.
So starting at your y-intercept of (0,-4), repeatedly move right 1 and up 1 to plot another point, until you have enough points to make a relatively accurate line.
Or you could just go 5 to the right and up 5 and plot just one more point.
When you have enough points, draw the line containing all the points. Remember that the line continues infinitely in both directions; it doesn't just contain the points you plotted.
|
|
|
| |