Question 752382: when graphing y < -6, should the region below the line y = -6 be shaded or should the region above the line y = -6 be shaded?
Answer by KMST(5328)   (Show Source): (Show Source):
You can put this solution on YOUR website! Whenever a linear inequality is involved,
one side of the line is part of the solution and is shaded,
while the other side of the line is not part of the solution and is not shaded.
The dashed line in the graph below is the graph of  . .
That line includes all the points with .
Those points would be part of the solution of  , ,
but they are not part of the solution for  . .
To indicate that the line is not part of the solution we draw it as a dashed line.
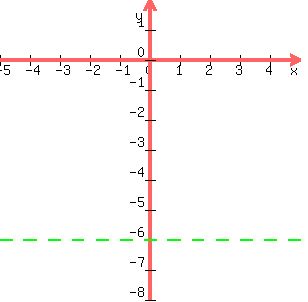
The solution to the inequality is all the points that have .
That means that the value of the y-coordinate of those points is less that -6, so they are below the line.
So the part below the line is shaded.
There is an easy, intuitive way to figure out which side of the line to shade.
You chose a "test point" that is not on the line, and see if it is part of the solution.
If it is you shade the side of the line that contains your test point.
If the test point is not part of the solution, you shade the other side.
The origin, (0,0), is often a good test point (It makes calculations easier).
Other easy test points are (1,0), (0,1) and (1,1).
In this case, I would chose the origin, (0,0). The origin has  and and 
To be part of the solution it would need to have , and that is not true for (0,0).
So the origin is not part of the solution, and you shade the side of the line that does not contain the origin.
|
|
|