SOLUTION: Please help me on this math problem. Unfortunately I was not able to include a picture in this submission, so I posted a link to that question below. Just copy and paste the link o

Algebra ->  Graphs -> SOLUTION: Please help me on this math problem. Unfortunately I was not able to include a picture in this submission, so I posted a link to that question below. Just copy and paste the link o      Log On


Question 965515: Please help me on this math problem. Unfortunately I was not able to include a picture in this submission, so I posted a link to that question below. Just copy and paste the link onto your address bar. Please help me tutors, I'd really appreciate any help! God bless :)
https://answers.yahoo.com/question/index?qid=20150422153804AACPJzS

Found 2 solutions by Theo, rothauserc:
Answer by Theo(13342) About Me  (Show Source):
You can put this solution on YOUR website!
here's an online statistics calculator that will help.
http://www.alcula.com/calculators/statistics/

you would take your data and enter it into the regression calculator.

it will then generate a scatter plot and a trend line for you.

you enter the x and y values as x,y on each line.

x is the number of people in each household and y is their monthly water bill.

the input will look like this:

$$$

you enter your x value and y values for each pair of data as x,y.

x is the number of people in the household and y is the monthly water bill for that household.

you can use the scatter plot generator to get a scatter plot of the data.

this plots the x values on the x axis and the y values on the y axis.

the output of that looks like this:

$$$

you use the regression calculator to generate your trend line.

that output looks like shis:

$$$

you get the correlation coefficient by running the correlation coefficient calculator.

that output looks like this:

$$$

the r^2 value tells you how good your fit is.

r^2 is the valuoe or r squared.

with this data, r^2 will be equal to roughly .98515 square = .97052 which is a pretty good fit.

any r^2 greater than .9 is a good fit.

your regression calculator tells you that:

the equation for the line of best fit is y = 0.61 * x - 0.33

the calculator shows you much more accuracy, but for practical purposes, this is good enough to get the general idea of how that equation will look on a graph.

if youo need a tutorial on correlation and regression, then the following links might be helpful.

http://www.regentsprep.org/regents/math/algebra/AD4/indexAD4.htm

Answer by rothauserc(4718) About Me  (Show Source):
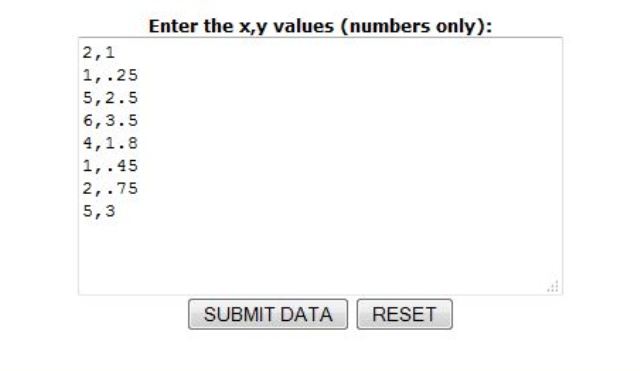
You can put this solution on YOUR website!
We are given the following information
x-axis(People) 2, 1, 5, 6, 4, 1, 2, 5
y-axis(Bill**) 1, 0.25, 2.5, 3.5, 1.8, 0.45, .75, 3
***************************************************
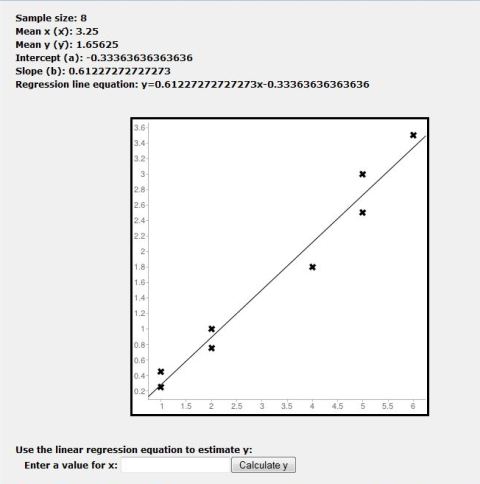
a) the points are graphed with their x, y coordinates, for example
(2, 1) is the first of 8 points
***************************************************
b) This is a linear regression problem without a y intercept (no x value = 0)
The general form of the equation is y = b*x where
b = (summation from i = 1 to 8 of xi*yi) / (summation from i = 1 to 8 of xi^2)
b = (2×1)+(1×0.25)+(5×2.5)+(6×3.5)+(4×1.8)+(1×0.45)+(2×0.75)+(5×3) / 2²+1²+5²+6²+4²+1²+2²+5²
b = 59.9 / 112 = 0.534821429
therefore the regression equation is
y = 0.534821429 * x, where * means multiply
***************************************************
the trend line is a good fit if
1) same number of point above the line as below the line
2) are they evenly distributed
***************************************************
c) our equation is
y = 0.534821429 * x
we are asked what is x for 150, then y = 150 / 100 = 1.5
1.5 = 0.534821429 * x
x = 1.5 / 0.534821429
x = 2.804674457 approx 3
size of household is 3 people