Question 965308: How do you graph 2x – y > –2, x – y > –1? I've been struggling with this
Answer by Fombitz(32388)   (Show Source): (Show Source):
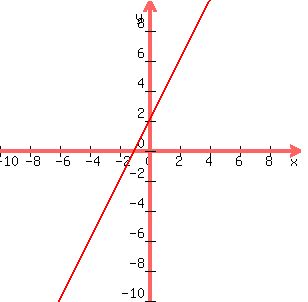
You can put this solution on YOUR website! First graph


.
.
.
.
.
Then choose a point not on the line and test the inequality.
(0,0) is convenient.


True, shade the region containing (0,0).
.
.

.
.
.
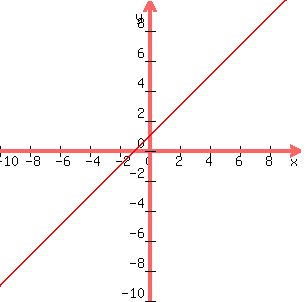
Now do the same for the other inequality,


.
.
.
.
.
Then choose a point not on the line and test the inequality.
(0,0) is convenient.


True, shade the region containing (0,0).
.
.

.
.
.
So now putting it all together,

Find the point of intersection,


Then,

.
.
.

.
.
.
The solution region would still be the region containing (0,0) but now its boundaries have been modified.
I can't show it here like the graphs above due to software limitations.
.
.
.
 . .
|
|
|