Question 943642: I dont understand what plots to point. the question is graph f(x) = 3 and another problem is graph f(x) = 2x. I have to plot the points and determine the slope of the graph. These are two separate problems
Found 2 solutions by josgarithmetic, Alan3354:
Answer by josgarithmetic(39617)   (Show Source): (Show Source):
You can put this solution on YOUR website! How do you not understand what points to plot? Pick some x values and find the corresponding y or "f(x)" values. Both of your functions are lines, so pick at least two points for each function.
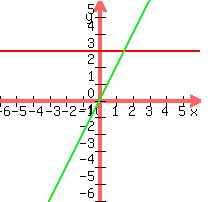
f(x)=3 in red and f(x)=2x in green
Answer by Alan3354(69443)  (Show Source): (Show Source):
You can put this solution on YOUR website! I dont understand what plots to point [sic] --> points to plot, I think. the question is graph f(x) = 3 and another problem is graph f(x) = 2x. I have to plot the points and determine the slope of the graph
============
f(x) = 3
f(x) is y, the vertical axis usually.
For any x, y = 3
eg, (0,3), (3,3), (100,3)
The slope is diffy/diffx. y is not changing, so diffy = 0
Slope = 0
===============================
f(x) = 2x
y = 2x
---
It's a straight line.
Pick 2 values for x and find y.
eg, x = 0 --> y = 0
x = 2 --> y = 4
Plot (0,0) and (2,4)
Draw a line thru them.
--------
Slope = diffy/diffx = (4-0)/(2-0) = 2
|
|
|