Question 669418: Okay, First of all here is the question. "Graph the following quadratic equation  ." ."
I am learning on how to graph quadratic equations using the following formula  and and  in the assignment. Being that H=x the axis of symmetry and (h,k) is the vertex. How do I graph this? This is what I have done so far. in the assignment. Being that H=x the axis of symmetry and (h,k) is the vertex. How do I graph this? This is what I have done so far.

A=1
B=4
C=0
Now using the following formula I can find if the parabola has what type of points.
b2-4ac means  = 16 meaning has to equal points right? I am not sure this is where I am confused... = 16 meaning has to equal points right? I am not sure this is where I am confused...
If my work here didn't make any sense just ignore it.
Thank you so much.
Answer by lwsshak3(11628)   (Show Source): (Show Source):
You can put this solution on YOUR website! Graph the following quadratic equation
The graph of quadratic equations are parabolas.
The best way to do this is convert the equation to a form which will give you information with which you can draw the graph. The standard form of equation for a parabola, y=a(x-h)^2+k, which you just learned is such a form. It provides you with the following information:
(h,k)=(x,y) coordinates of the vertex.
axis of symmetry
if a>0, the parabola opens upwards, curve has a minimum
if a<0, the parabola opens downwards, curve has a maximum
..
For given equation:
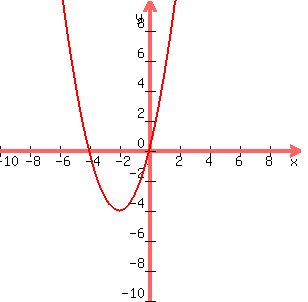
F(x)=x^2+4x
complete the square
F(x)=(x^2+4x+4)-4
F(x)=(x+2)^2-4
This is an equation of a parabola that opens upwards(a=1)
Its vertex: (-2,-4) minimum of -4 at x=-2
axis of symmetry: x=-2
x-intercept:
set y=0
x^2+4x=0
x(x+4)=0
x=0
and
x=-4
you now have the information needed to draw the graph of the parabola.
see the following graph below:
|
|
|