Question 669204: 13- Show work, graph the function using transformations, state domain, range and asymptotes
F(x)=5- 1/(x+4)˛
Answer by KMST(5328)   (Show Source): (Show Source):
You can put this solution on YOUR website!  is related to the functions is related to the functions  and and  . .
You know that the function has a graph like this:
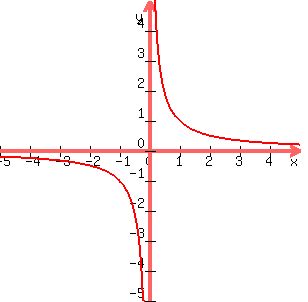 . .
The x-axis ( ) is a horizontal asymptote that the function approaches as ) is a horizontal asymptote that the function approaches as  and and  become larger and larger, become larger and larger,
and you know that the function
does not exist for  because you cannot divide by zero. because you cannot divide by zero.
Instead, you have a vertical asymptote at ,
and there is no limit to the values  can take. can take.
It is never zero, but can take any other value.
Something similar happens with the function ,
which does not exist for and graphs as 
The only difference is that is never negative.
The domain is all real numbers except zero; the range is all  , and the asymptotes are the same. , and the asymptotes are the same.
The function  is like , is like ,
but everything is shifted 4 units to the left.
What happened to for ,  , and , and
now happens for at  , ,  , and , and  . .
The graph for is 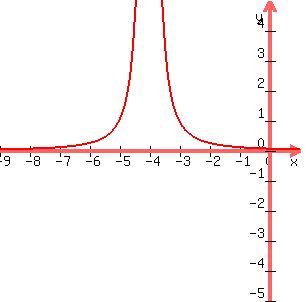 . .
The vertical asymptote is  . .
(All other real numbers are in the domain of ).
Adding a minus sign in front just flips the graph.
Everything becomes the reflection under the x-axis:

Adding  to that, just moves the graph (and asymptotes) up by 5 units. to that, just moves the graph (and asymptotes) up by 5 units.

The domain is all the real numbers except .
The vertical asymptote is .
The range is all  . .
The horizontal asymptote (shown in green) is  . .
|
|
|