Question 66375: I cannot seem to understand the way my book tells me to graph inequalities. It tells me that I first have to graph the boundary line for the example x-y<1. I don't know how to graph that. My book tells me something about using points, but I don't know how to find the points. And after the book somehow fnds their points, the use test points and shade part of the graph, I don't know what test points are.
Answer by stanbon(75887)   (Show Source): (Show Source):
You can put this solution on YOUR website! I cannot seem to understand the way my book tells me to graph inequalities. It tells me that I first have to graph the boundary line for the example x-y<1.
--------
The boundary line is the equality associated with the inequality.
In your problem the boundary line is x-y=1
or y=x-1
-------------
I don't know how to graph that. My book tells me something about using points, but I don't know how to find the points.
You only need two points to determine the graph of a line.
Since y=x-1
Let x=0, then y=0-1=-1 giving you the point (0,-1)
Let x=2, then y=2-1=1 giving you the point (2,1)
Plot those two points and draw a line through them to get:
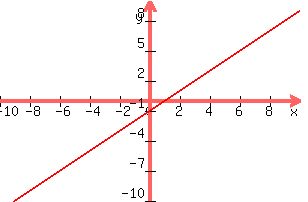
Comment: That is the boundary of the inequality; it is
not the graph of the inequality.
----------------
And after the book somehow fnds their points, they use test points and shade part of the graph, I don't know what test points are.
Any point that is not on the boundary can be used as a test point.
Pick a point like (5,5)
Substitute those x, y values into the inequality and see if you get
a true statement.
The inequality is y>x-1
Substituting you get 5>5-1 or 5>4.
That is true so that side of the boundary line is the solution
to the inequality and should be shaded to indicate that fact.
Hope this helps.
Cheers,
Stan H.
|
|
|