Question 657547: How would I graph the system of inequalities y<2x-1
x+y>=2
Answer by KMST(5328)   (Show Source): (Show Source):
You can put this solution on YOUR website! Since there is an  and a and a  in your system, you need an x-axis and a y-axis in your graph. in your system, you need an x-axis and a y-axis in your graph.
Each inequality will be represented as the half of the x-y plane to one side of a boundary line.
The equation  represents one of those boundary lines, and is graphed as a solid line, because all the points on that line are part of the solution to represents one of those boundary lines, and is graphed as a solid line, because all the points on that line are part of the solution to
 . Any point (x,y) in that line satisfies and also satisfies . . Any point (x,y) in that line satisfies and also satisfies .
 is the graph (line) for , and the inequality graphs as is the graph (line) for , and the inequality graphs as 
The equation  represents the boundary line for represents the boundary line for  , and is graphed as a dashed line, because the points (x,y) with do not satisfy , and is graphed as a dashed line, because the points (x,y) with do not satisfy
To graph each line you need 2 points.
To get a point you chose a value for and find the corresponding or the other way around. A value of zero is often a good choice.
FOR :
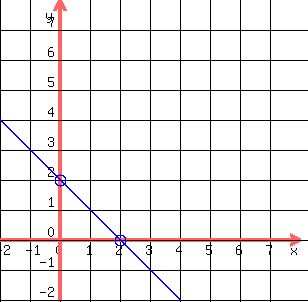
 gives you gives you  --> -->  for the point (0,2). for the point (0,2).
 gives you gives you  --> -->  for the point (2,0). for the point (2,0).
You plot the two points and connect them with a line to graph
FOR :
You graph the line as shown above. It is a solid line because there is a "=" in the inequality, and that causes the solutions to to be solutions of .
Next, you figure out which side of the line to shade or color.
An easy way to do it is to pick a point on one side of the line and check if it is part of the solution.
The easiest choice (if not on the line) is the point (0,0), with 
For that point  , so that point is not part of the solution. , so that point is not part of the solution.
FOR :
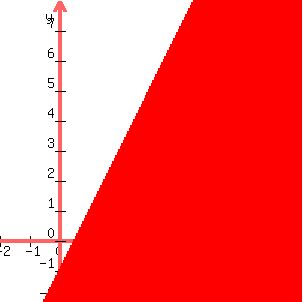
You plot the line for as a dashed line, because it is not part of the solution.
gives you  --> -->  for point (0,-1). for point (0,-1).
Choosing would not make the calculations or the graphing easy, so I pick  for the second point. for the second point.
gives me  --> -->  for point (3,5). for point (3,5).
I plot the points and connect them with a dashed line:
 Finally, I decide which side of the line is the solution to . Finally, I decide which side of the line is the solution to .
Using (0,0), the origin, as a test point, I figure that the solution is the side that does not contain the origin,
because substituting into , I get
 , which is not true. , which is not true.
The colored graph of the inequality will look like this:
The solution to the system is the part of the x-y plane that is a solution to both inequalities. It graphs as the colored or shaded pie wedge bounded by the lines, as shown below.

|
|
|