Question 590300: Please Help me.
write an equation and graph it
1.) A quadratic function with x-intercept (3,0)and(-6,0)and y-intercept (0,-5)
5.) A cubic function with x-intercept (1,0)(-1/2,0)and(1/4,0)and y-intercept(0,2)
Answer by KMST(5328)   (Show Source): (Show Source):
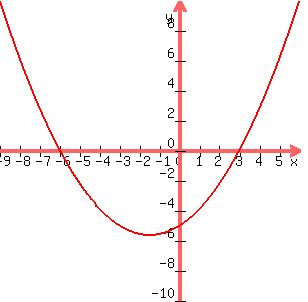
You can put this solution on YOUR website! 1.)
A quadratic polynomial with zeros at x=3 and x=-6, must have (x-3) and (x+6) as factors (and no other factor involving x).
So, it would be
 for some non-zero number K. for some non-zero number K.
For x=0,  --> --> 
 is your function. is your function.
You know the graph is a prabola, you know the intercepts,and you know that it opens up because the leading coefficient (5/18) is positive.
The axis of symmetry of the parabola has to be exactly halfway between its zeros, at 
The minimum (vertex) of the parabola has 
and 
Graphing parabolas, with all that information is easy.
2.) For the second function it would be

We do not need to do the whole multiplication to figure out that the independent term (you may call it constant) is 
For x=0,  --> K=16 --> K=16
The function is 
Its zeros are -1/2, 1/4 and 1, and are the points were it changes sign.
It is negative for  , ,
positive for  (including x=0, where y=2), (including x=0, where y=2),
negative for  , ,
and positive for 
GRAPHING:
Depending on what you are being taught in class is how you would graph the function in problem 2.
If they are teaching you the use of a graphing calculator or some graphing program, you would use that.
If your class is calculus, you would find the derivative, and locate maxima and minima.
Otherwise, you may calculate the value of the function for a few values of x (maybe x=-1, x=1/2, and x=2), plot those points and the intercepts, and sketch a curve that reasonable passes through all those points.
This website will graph for me.

|
|
|