Question 537572: I am having difficulty finding the points for graphing equations. In other words, I need the points for the variables x and y for these equations so I can lot the points on a graph. I do not understand the processes of finding the points. Would you give an example of all the steps for each equation giving the points to plot. I am doing these equations for practice because I have a quiz Wednesday. equations: y = 3x - 2, 6x - 3 = x - y, y = |X| - 2 and 4x + 2 = 5x + 4
Found 2 solutions by josmiceli, KMST:
Answer by josmiceli(19441)   (Show Source): (Show Source):
You can put this solution on YOUR website! The x-axis is horizontal and the y-axis is vertical
When you have an equation  , like , like  , ,
think of it as passing though the points
(x1,y1), (x2,y2), (x3,y3), (x4,y4) . . . etc.
For any of these points, if I know x I can find y
If I know y, I can find x.
Suppose (x1,y1) = (22,y1)
Just replace x with 22, and you find y1:

 , so the point is (22,45) , so the point is (22,45)
-----------------------------
Two special points are (0,y1) and (x1,0)
These are called intercepts because they lie on the
vertical and horizontal axes
If I have (0,y1), I can find y1

 , so the point is (0,1) , so the point is (0,1)
----------------------------
You can turn the problem around and say
" Does the point (9,11) lie on this equation?"
To find out:


This means the point does not lie on the equation
Does the point (43, 87) lie on the equation?


Yes, this point is on the equation
---------------
All you need is 2 points to plot a straight line, but
you can find as many points as you want, and they
will all lie on the line.
---------------
I doesn't matter how the equation is written, you
just need x's and y's
Suppose I have

I have (3,y1). What is y1?


 , so my point is (3,2) , so my point is (3,2)
---------------
Hope this helps
Answer by KMST(5328)  (Show Source): (Show Source):
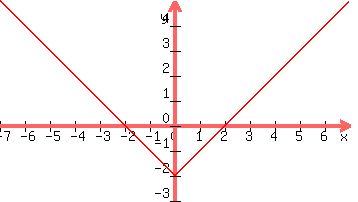
You can put this solution on YOUR website! WHEN YOU FIND ABSOLUTE VALUES
There is an angle at x=0 in the graph of y = |x| - 2. Absolute values make graphs "bounce" at points where the expression inside the absolute value goes through zero, so you definitely have to plot the "bounce" points.
At x=0, y=-2, so you plot the point (0,-2).
For positive x values it's  and you could chose another point, like (6,4) (x=6, y=6-2=4), and draw the line from (0,-2) through your second point and to the edge of your graph. and you could chose another point, like (6,4) (x=6, y=6-2=4), and draw the line from (0,-2) through your second point and to the edge of your graph.
For negative x values the line will look like a mirror image going from (0,-2) up and to the left through (-6,4).
Because the x is inside the absolute value sign, the function (y) will have the same value for x as for -x, making it symmetrical on both sides of the y-axis.
GRAPHING LINEAR EQUATIONS
 can be solved to find a single value of x. can be solved to find a single value of x.
--subtract 4 from both sides--> --subtract 4x--> --subtract 4x--> ---more elegantly written as---> ---more elegantly written as--->
Variable y is not involved. If you had to graph it on an x-y coordinate plane, it would be a vertical line, all its points having the same value for x, along with any and all possible values for y.
You could also find equations for horizontal lines, like y=2, where all the points have the same y, but can have any and all possible values for x.
In other cases, you'll need to plot two points to draw the line.
 , and , and 
are equations representing straight lines. Once you plot two points, you can draw the line.
is written in slope-intercept form, that starts with "y=". You can see that the line passes through the point (0,-2) because for x=0, y=-2. That point is the y-intercept, where the line crosses the y-axis. That is a good point to plot. You could pick any other point that would fit in your graph. Chose whatever method to find it and whatever point is easier for you. Maybe pick x=4, and calculate y, which would give you y=10. You can also see that for every increase of 1 unit on x, y increases by 3 units. That rate of increase is the slope, the number that multiplies the x in the slope-intercept form. You can find points in the line by moving from one to the other like a chess horse, one unit to the right and 3 up, and plot points without doing calculations. The slope is always useful to do that.
needs a little work, because you have x on both sides of the equal sign. If you subtract x from both sides, and then multiply by -1, you get the slope intercept form.
--> --> --> ---more elegantly written as---> ---more elegantly written as--->
You can see that the line goes through (0,3), the y-intercept, and that with a slope like -3, it goes down steeply to the right. Plot the y-intercept and another point like (2,-7) and draw the line.
EXTRA EXAMPLES
If it's the equation of a straight line, you just need two points. It is not necessary to have the equation in the slope-intercept form to find your two points. Some other forms of the equation can be helpful. You may be lucky and the equation may be easy to graph as given. For example
 , or its equivalent , or its equivalent  , gives you two easy to find points to plot: , gives you two easy to find points to plot:
When x=0, it is easy to see that y=6, so you plot point (0,6) on the x-axis.
When y=0, it is not hard to see that x=3, so you plot point (3,0) on the y-axis.
Those points are the x-intercept and y-intercept, and luckily they are easy to plot and far apart enough to let you draw a good line.
 also gives you easy to find intercepts (7,0) and (0,5) and would be easy to graph. also gives you easy to find intercepts (7,0) and (0,5) and would be easy to graph.
Sometimes you may want (or need) to transform the equation into an equivalent form that's easier to graph.
 has (0,1/5) and (1/7,0) for intercepts, but those are not good points to plot. Picking any value for x and solving for y is likely to give you unwieldy fractions. The slope-intercept form could help a little. has (0,1/5) and (1/7,0) for intercepts, but those are not good points to plot. Picking any value for x and solving for y is likely to give you unwieldy fractions. The slope-intercept form could help a little.
--> --> --> --> --> --> --> <--- slope-intercept form <--- slope-intercept form
The equations in the middle suggest that a value for x that makes -7x+1 a multiple of 5 would give you an integer value for y, and a good point to plot. You could think of x=-7, or x=-2, or x=3, and get one or two of the points (-7,10), (-2, 3), (3,-4).
If you only get one point, the slope will help you get a second one. The slope is -7/5, telling you that y decreases by 7 as x increases by 5 (and that y increases by 7 as x decreases by 5 as you move in the other direction). So you would move from your first point 5 units to the right and 7 down (or 5 to the left and 7 up) to mark a second point.
|
|
|