I need help with sketching the graph of this factored polynomial
 The roots, zeros, x-intercepts, or solutions
(they are called by all four names at different times and are the
places where the curve comes in contact with the x-axis)
are found by setting the expressions in the parentheses = 0
x+1=0, x-2=0, x-1=0
and solving, getting
x=-1, x=2, and x=1
When you have something like this:
The roots, zeros, x-intercepts, or solutions
(they are called by all four names at different times and are the
places where the curve comes in contact with the x-axis)
are found by setting the expressions in the parentheses = 0
x+1=0, x-2=0, x-1=0
and solving, getting
x=-1, x=2, and x=1
When you have something like this:  as a factor
of a polynomial then we say R is a zero with multiplicity of N.
If N is an even number the graphed curve "bounces" off the x-axis
at R, and if N is an odd number, the graphed curve cuts through
the x-axis at R.
Since the exponent 4 in
as a factor
of a polynomial then we say R is a zero with multiplicity of N.
If N is an even number the graphed curve "bounces" off the x-axis
at R, and if N is an odd number, the graphed curve cuts through
the x-axis at R.
Since the exponent 4 in  is even, we know that the
graphed curve "bounces off" the x-axis at -1.
Since the exponent 3 in
is even, we know that the
graphed curve "bounces off" the x-axis at -1.
Since the exponent 3 in  is odd, we know that the
graphed curve cuts through the x-axis at 2.
Since the understood exponent 1 in
is odd, we know that the
graphed curve cuts through the x-axis at 2.
Since the understood exponent 1 in  is odd, we know that the
graphed curve cuts through the x-axis at 1.
The y-intercept is found by substituting 0 for x in
is odd, we know that the
graphed curve cuts through the x-axis at 1.
The y-intercept is found by substituting 0 for x in


 So we draw the graph this way. We start at the y-intercept and draw
downward to the left so that the curve bounces off the x-axis at -1.
Then to the right it eventually goes down and cuts through the x-axis
at 1 and 2.
Here is the graph
So we draw the graph this way. We start at the y-intercept and draw
downward to the left so that the curve bounces off the x-axis at -1.
Then to the right it eventually goes down and cuts through the x-axis
at 1 and 2.
Here is the graph
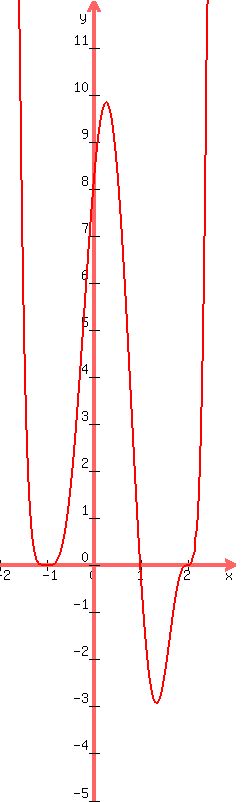 The graph cuts through the x-axis at 1 and 2 and "bounces off" the
x-axis at -1. To draw it accurately like this you would
have to plot some more points.
Edwin
The graph cuts through the x-axis at 1 and 2 and "bounces off" the
x-axis at -1. To draw it accurately like this you would
have to plot some more points.
Edwin

