Question 359247: Graph the line: x - y = -7
Found 2 solutions by ewatrrr, geforcewong:
Answer by ewatrrr(24785)   (Show Source): (Show Source):
Answer by geforcewong(2)  (Show Source): (Show Source):
You can put this solution on YOUR website! x - y = -7 <-- This equation should be converted into slope-intercept form (y = mx + b). Once you get an equation into y = mx+b form,
m = slope, b = y-intercept. So let's convert the equation into y=mx+b form:
-y = -7 - x <-- Moved the x to the right side of the equation
y = 7 + x <-- Multiplied both sides by -1)
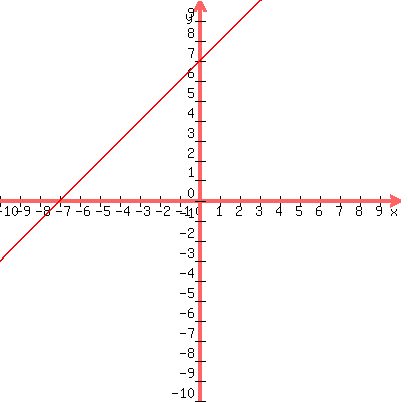
y = x + 7 <-- Equation is now in slope-intercept form (y=mx+b). So the slope of the line is 1 because x = 1x. Y-intercept is 7. This means the line intersects the y-axis at coordinate: (0,7).
Now to form a line once the y-intercept is plotted on the graph you can:
Option 1: Find the x-intercept.
The x-intercept is where the line intersects the x-axis. this means y = 0. Plug in y = 0 into y=x+7 and it will give you:
0 = x + 7 <= Plugged in 0 for y)
0 - 7 = x + 7 - 7 <= Subtract 7 to both sides
-7 = x or x = -7 <=Simplify
So the x intercept is -7, which means the x-intercept coordinate is (-7,0).
So plot coordinate (-7,0) on the graph. With the x-intercept (-7,0) and the y-intercept (0,7), use a ruler and draw a straight line through the two points.
Option 2: Plug in random x-values into the equation y = x + 7 to get the corresponding y-coordinate.
Example, when x = 1, y = 8. When x = 2, y = 9. When x = -1, y = 6.
With coordinates (1,8),(2,9) and (-1,6) you can plot these points on a graph and draw a straight line through the points to give your correct line.
|
|
|