Question 35510: I have the answer, I just need to know how to graph the answer that I have. I have tried to make the graph several times, but it is not working out correctly. Here is the whole question and then the answer I have for the first part, and the second part of the question is the graph.
For the function,
Give the y values for x = -2, -1, 0, 1, 2, 3.
Answer: y=1/(x-2)
(-2,-.25),(-1,-.333333),(0,-.5),(1,-1),(2,undefined)
Using these points, draw a curve.
Show graph here.
Answer by venugopalramana(3286)   (Show Source): (Show Source):
You can put this solution on YOUR website! I have the answer, I just need to know how to graph the answer that I have. I have tried to make the graph several times, but it is not working out correctly. Here is the whole question and then the answer I have for the first part, and the second part of the question is the graph.
For the function,
Give the y values for x = -2, -1, 0, 1, 2, 3.
Answer: y=1/(x-2)
(-2,-.25),(-1,-.333333),(0,-.5),(1,-1),(2,undefined)
YOU ARE 100% CORRECT.WHY ARE YOU HESITATING TO PLOT?
THE ONLY TROUBLE YOU HAVE IS WITH X=2..Y= INFINITY OR UNDEFINED AS YOU CORRECTLY SAID..VERY GOOD...SO DONT PLOT IT.INSTEAD TAKE FEW NEIGHBORING POINTS AND PLOT TO GET AN IDEA.
SAY X=1.9....Y=-10.....X=1.99......Y=-100
SAY X=2.1....Y=10......X=2.01......Y=100
YOU MAY ALSO PLOT X=3....Y=1..AS GIVEN
SO THE GRAPH IS AS FOLLOWS
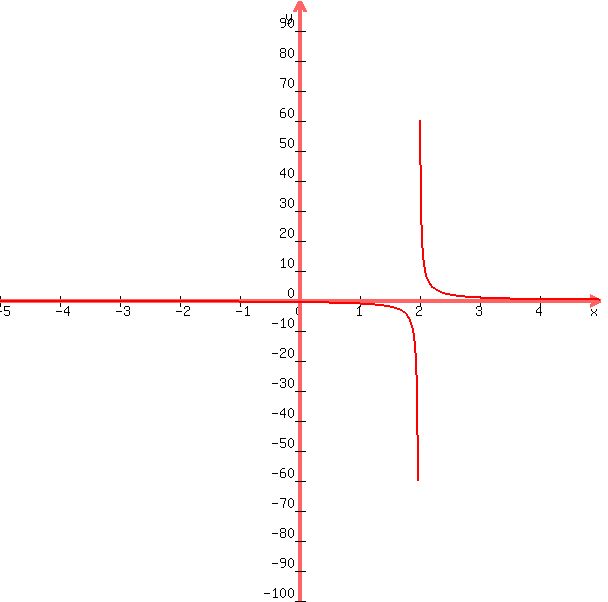
AT AROUND X=2 ON EITHER SIDE JUST DRAW A PALLEL LINE CLOSE TO IT .REST IS NORMAL GRAPH
|
|
|