Question 35215: In most business, increasing proces of their product can have a negative effect on the number of customers of the business. A bus company in a small town has an average number of riders of 800 per day. The bus company charges $2.25 for a ride. They conducted a survey of their customers and found that they will lose approximately 40 customers per day for each $.25 increase in fare.
Given the description above, graph the function, identify the graph of the function, and give the domain and range as shown in the graph, and also the domain and the range of the entire function excluding unrealistic values.
Answer by AnlytcPhil(1806)   (Show Source): (Show Source):
You can put this solution on YOUR website!
In most business, increasing proces of their product can have a negative effect
on the number of customers of the business. A bus company in a small town has
an average number of riders of 800 per day. The bus company charges $2.25 for
a ride. They conducted a survey of their customers and found that they will
lose approximately 40 customers per day for each $.25 increase in fare.
Given the description above, graph the function, identify the graph of the
function, and give the domain and range as shown in the graph, and also the
domain and the range of the entire function excluding unrealistic values.
These instructions are incomplete. You didn't tell us what you want
to express in terms of what, so I can only guess that you want to
express the bus company's daily income as a function of the number
of 25 cent increases in the fare. If that was not what you wanted,
then you'll have to post again with the complete instructions.
Income = (new higher fare)×(new lower number of passengers)
Let x = the number of price increases of $0.25 each in the fare
Then .25x will be the increase in the fare
Then the new higher fare will be " 2.25 + .25x " dollars
Then " 40x " will be the decrease in the number of passengers.
Then " 800 - 40x " will be the new lower number of passenger
Income = (new higher fare)×(new lower number of passengers)
Let y = income
y = (2.25 + .25x)(800 - 40x)
Use FOIL
y = 1800 - 90x + 200x - 10x˛
y = -10x˛ + 110x + 1800 or in functional notation,
y = f(x) = -10x˛ + 110x + 1800
This plots as this parabola.
y = daily income
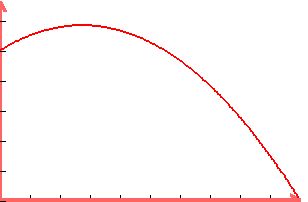 0 x = no. of 25c increases
The smallest value in the domain is when there are
NO 25c increases, i.e., when x = 0.
The largest value in the domain will be when the fare
is so high that there will be NO passengers, which is when y = 0
So we set y = 0 and solve for x
y = -10x˛ + 110x + 1800
y = 0
-10x˛ + 110x + 1800 = 0
Divide every term by -10 to simplify
x˛ - 11x - 180 = 0
Factor:
(x + 9)(x - 20) = 0
Use zero-factor property, set each factor = 0
x + 9 = 0 gives x = -9 which we discard as this
is outside domain
x - 20 = 0 gives x = 20, which is the largest
value in the domain. So domain =
{x | 0 < x < 20}, or in interval notation, [0, 20]
For the range, the smallest value of y is, of course, 0.
To find the largest value of y in the range, we will need to find
the vertex of the parabola.
The vertex of y = f(x) = Ax˛ + Bx + C is the point
( -B/(2A), f(-B/(2A)) )
y = f(x) = -10x˛ + 110x + 1800
A = -10, B = 110, C = 1800
-B/(2A) = -(110)/[2(-10)] = 5.5
f(-B/(2A)) = 2102.5
So the vertex is the point (5.5, 2102.5)
Therefore the largest value of y is 2102.5, or $2102.50
So the range = {y | 0 < y < $2102.50} or [0, 2102.50] in
interval notation.
$2102.50 is the income per day when 5.5 25c increases are
made in the fare.
The bus company makes the most money per day when there
are 5.5 25 cent increases, or an increase of $1.375, or a
fare of $3.625, but since people cannot cut pennies in
two they either have to charge $3.62 or $3.63.
Edwin
AnlytcPhil@aol.com
0 x = no. of 25c increases
The smallest value in the domain is when there are
NO 25c increases, i.e., when x = 0.
The largest value in the domain will be when the fare
is so high that there will be NO passengers, which is when y = 0
So we set y = 0 and solve for x
y = -10x˛ + 110x + 1800
y = 0
-10x˛ + 110x + 1800 = 0
Divide every term by -10 to simplify
x˛ - 11x - 180 = 0
Factor:
(x + 9)(x - 20) = 0
Use zero-factor property, set each factor = 0
x + 9 = 0 gives x = -9 which we discard as this
is outside domain
x - 20 = 0 gives x = 20, which is the largest
value in the domain. So domain =
{x | 0 < x < 20}, or in interval notation, [0, 20]
For the range, the smallest value of y is, of course, 0.
To find the largest value of y in the range, we will need to find
the vertex of the parabola.
The vertex of y = f(x) = Ax˛ + Bx + C is the point
( -B/(2A), f(-B/(2A)) )
y = f(x) = -10x˛ + 110x + 1800
A = -10, B = 110, C = 1800
-B/(2A) = -(110)/[2(-10)] = 5.5
f(-B/(2A)) = 2102.5
So the vertex is the point (5.5, 2102.5)
Therefore the largest value of y is 2102.5, or $2102.50
So the range = {y | 0 < y < $2102.50} or [0, 2102.50] in
interval notation.
$2102.50 is the income per day when 5.5 25c increases are
made in the fare.
The bus company makes the most money per day when there
are 5.5 25 cent increases, or an increase of $1.375, or a
fare of $3.625, but since people cannot cut pennies in
two they either have to charge $3.62 or $3.63.
Edwin
AnlytcPhil@aol.com
|
|
|