Question 212950: y = 2^x x = 2^y
Evaluate the exponential equation for three positive values of x, three negative values of x, and x =0. Transform the second expression into the equivalent logarithmic equation; and evaluate the logarithmic equation for three values of x that ar greater than 1, three values of x that are between 0 and 1, and at x = 1. Use the resulting ordered pairs to plot the graph of each function.
On the first equation I got y = 2^x
X Y 3 positives of x
1 2
2 4
3 8
X Y 3 negatives of x
-1 -2
-2 -4
-3 -8
X Y x = 0
0 2
I do not under stand the second part of this equation. Is the first part correct?
Found 2 solutions by rapaljer, Theo:
Answer by rapaljer(4671)   (Show Source): (Show Source):
You can put this solution on YOUR website! No! For y=2^x, when you use negative values for x, you do NOT get negative values for y! What you get is a fraction!
y=2^x
If x=-1, then y=2^-1 = 1/2
if x=-2, then y=2^-2 =1/4
If x=-3, then y=2^-3=1/8
Then the second part of the equation seems strange to me. Let me take a look at it. (You may find my explanation that I referenced below helpful for this part!)
Start with x=2^y, and change it to logarithmic form. In this case, 2 is the base number, y is the exponent, and x is the result. You can write this in logarithmic form as  , so , so  . .
Now, you are supposed to take 3 values of x that are greater than 1 (like x=2, 4, and 8, which would give you 3 values of y that are 1,2, and 3 respectively). I don't know if how I got these numbers is clear to you, but that's what they want you to do!
Then take 3 values of x that are between 0 and 1 (like x=1/2, 1/4, and 1/8, which give you values of y that are -1, -2, and -3 respectively).
If you graph these points, I suppose it should look like this:
See if that makes any sense to you!!
You might want to look at my own explanation of LOGARITHMS in which I begin my explanation with the graphs of y=2^x compared to x=2^y. I did a video a few years ago, and it is on my website for free if you want to see it. Do a "Bing" search for my last name "Rapalje", and look for "Rapalje Homepage." Near the top of my Homepage, I have a link called "Rapalje Videos". Click on that and choose "College Algebra". Look for the two videos on Logarithms. This would be the first one.
I also have my written explanation of Logarithms. From the top of my homepage, look for "Basic, Intermediate, and College Algebra: One Step at a Time", choose "College Algebra" and look for "Chapter 4, Logarithms." This is my own non-traditional explanation written for students who don't understand the traditional textbooks.
It might help you, and it's ALL free, like algebra.com!
R^2
Dr. Robert J. Rapalje, Retired
Seminole Community College
Altamonte Springs Campus
Florida
Answer by Theo(13342)  (Show Source): (Show Source):
You can put this solution on YOUR website! y = 2^x x = 2^y
Evaluate the exponential equation for three positive values of x, three negative values of x, and x =0. Transform the second expression into the equivalent logarithmic equation; and evaluate the logarithmic equation for three values of x that ar greater than 1, three values of x that are between 0 and 1, and at x = 1. Use the resulting ordered pairs to plot the graph of each function.
-----
FIRST EQUATION
-----

x is the exponent, 2 is the base.
-----
when x is positive:


-----
when x is negative:


-----
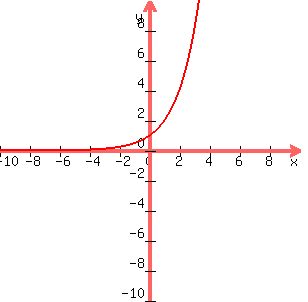
graph of y = 2^x is shown below:
-----
SECOND EQUATION
-----

y is the exponent, 2 is the base.
-----
when y is positive:
-----
when y is negative:
-----
You cannot graph this directly since the graphs are set up so that the independent variable is x and the dependent variable is y.
-----
In order to graph this, you have to solve for y.
-----
Your equation is:
-----
The basic definition of an exponential equation is:
 if and only if if and only if 
When you reverse the x and y like we have in this second form of the exponential equation, then the basic definition becomes:
 if and only if if and only if 
-----
Your equation is:
-----
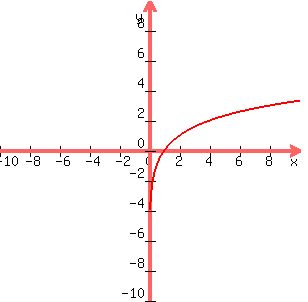
By the basic definition of exponents, if and only if 
-----
The graph of is shown below:
-----
-----
is the inverse equation of
You derive the inverse equation by doing exactly what they are asking you to do when they showed you the two equations.
-----
In order to find the inverse equation of you would do the following:
-----
Solve for x:
-----
By the basic definition of exponents, if and only if 
-----
You have just solved for x by just applying the basic definition of exponents.
-----
You have:
-----
Next you transpose the x and the y in the equation.
Your equation becomes:
-----
is the inverse equation of
-----
You have just derived the inverse equation of . That equation is
-----
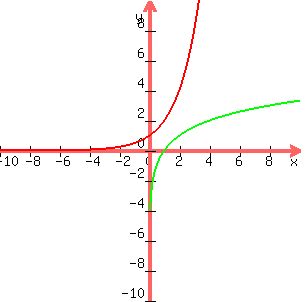
The inverse equation is the reflection of the normal equation about the line y = x.
The following graph shows the normal equation of and the inverse equation of and the line 
-----

-----
If you draw a perpendicular line anywhere through the line y = x, the intersection of that line through will be (a,b), and the intersection of that line through will be (b,a).
-----
for example:
when x = 2,  = 4 so the coordinates are (2,4) = 4 so the coordinates are (2,4)
when x = 4,  = 2 so the coordinates are (4,2) = 2 so the coordinates are (4,2)
-----
The equation of the line perpendicular to the line y = x and passing through the points (2,4) and (4,2) is y = -x + 6.
-----
Adding that line to the graph of the 3 equations yields the following:
-----

-----
As you can see, the two points intersecting with the line perpendicular to the line y = x are the same distance from that line making the two graphs symmetric to each other about the line y = x.
-----
|
|
|