|
Question 207124: Would someone help me out here; I need to graph x^2=16y on a graph, could someone show me how I should do that?
Found 2 solutions by Alan3354, Theo:
Answer by Alan3354(69443)   (Show Source): (Show Source):
You can put this solution on YOUR website! I need to graph x^2=16y on a graph, could someone show me how I should do that?
------------
If you do it manually, make a table and find several ordered pairs (= points on the curve).
1st, y = (x^2)/16
Pick values for x and solve for y.
eg,
x y
0 0
1 1/16
2 1/4
etc.
--------
Use the FREE software from
http://www.padowan.dk.com/graph/
Answer by Theo(13342)  (Show Source): (Show Source):
You can put this solution on YOUR website! first you have to solve for y.
-----
x^2 = 16y is the same as:
16y = x^2
divide both sides of the equation by 16 to get:
y = x^2/16
-----
now that you solved for y, you can graph the solution.
-----
to manually create the graph, get some graph paper and figure out where you want your x-axis to be and your y-axis to be.
-----
since your x values are going to be plus or minus the same numbers, then your y-axis should be in the middle of the paper so you can have equal values of x to the left of that line and equal values of x to the right of that line.
-----
since your y values are going to be much higher on the top rather than the bottom since all y values will be positive, then your x-axis should be in the lower part of the paper so you can have greater values of y on top of that line and only small or no values of y below that line.
-----
your x-axis will be a horizontal line.
your y-axis will be a vertical line.
-----
calculate the scale you want from left to right.
if you want x to go from -100 to + 100 then from the y-axis go 10 vertical lines to the left and 10 vertical lines to the right. each vertical line will represent 10 units of x.
-----
if you want y to go from -100 to + 700 then from the x-axis go 10 horizontal lines down and 70 horizontal lines up. each horizontal line will represent 10 units of y.
-----
plot some (x,y) coordinate points using your equation of y = x^2/16
-----
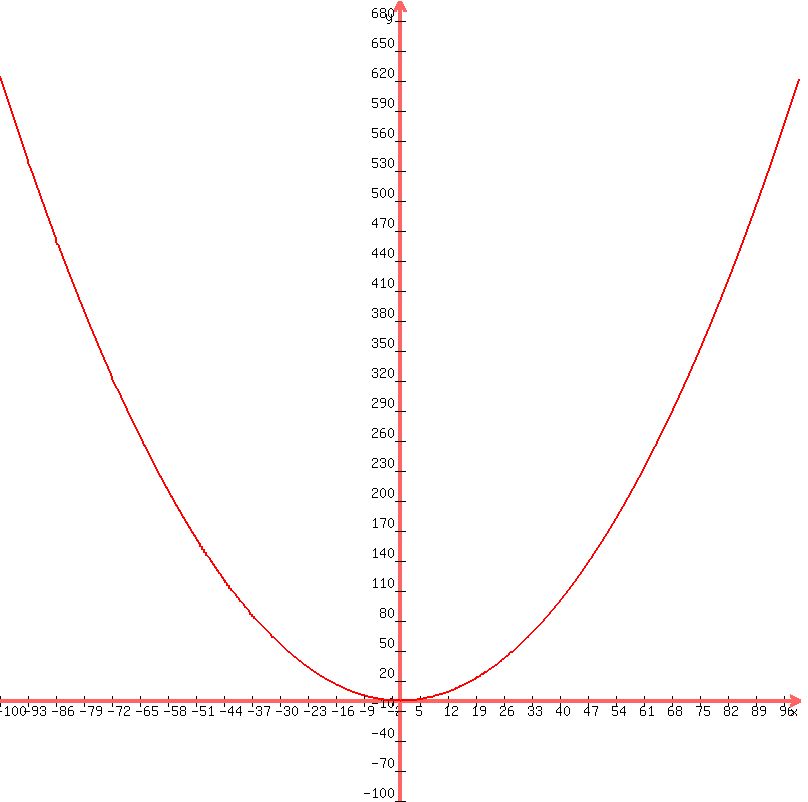
for x = 0, y = 0
for x = 20, y = 25
for x = 40, y = 100
for x = 60, y = 225
for x = 80, y = 400
for x = 100, y = 625
for x = -20, y = 25
for x = -40, y = 100
for x = -60, y = 225
for x = -80, y = 400
for x = -100, y = 625
-----
your graph should look like something like this:
-----
in theory I didn't need to go negative on the y values, but the graphing calculator used here requires some value below the x-axis in order to draw the x-axis properly.
-----
for your purposes on a manually created graph, you could have had no values of y below the x-axis meaning that the x-axis could have been the bottom of your graph.
-----
key is to solve for y and then plot points and then graph.
-----
scale is whatever your make it. for my example:
I used 1 vertical line of graph paper per 10 units of x
I also used 1 horizontal line of graph paper per 10 units of y.
-----
you can scale to whatever suits your purposes.
for example if you did not have 70 horizontal lines available, but only 50, you would scale maybe 1 horizontal line of graph paper per 20 units of y. this way you would only require 35 horizontal lines.
-----
the range of values you can have and the number of vertical or horizontal lines you have available will definitely be a factor in determining the scale.
|
|
|
| |