Question 184270This question is from textbook
: I have a problem graphing y= 3x and y = -x + 4
This question is from textbook
Found 2 solutions by rapaljer, MathGuyJoe:
Answer by rapaljer(4671)   (Show Source): (Show Source):
You can put this solution on YOUR website! Since both of these equations are in slope-intercept form, I recommend the slope-intercept method of graphing them. If you need additional explanations on this, I have a good Lesson PLan on this method here in algebra.com, or go to my website by clicking on my tutor name "rapaljer" anywhere in algebra.com. Look on my homepage for "Basic Intermediate and College Algebra: One Step at a Time." Select "Basic Algebra" and look for Chapter 5 on Graphing.
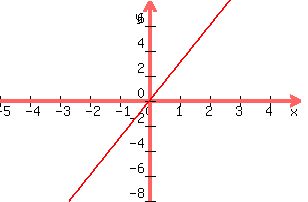
Now to solve the prlblem. The first graph y=3x is actually y=3x+ 0, so it has a y-intercept of 0 and a slope of 3. Plot the point (0,0). From this point move UP 3 units and RIGHT 1 unit and plot another point. Connect the two points with the first line.
FOr the second graph y=-1x+4, the y intercept is 4, so go UP 4 units on the y axis and plot the first point. Then, with your pencil on this point, move DOWN 1 unit and RIGHT 1 unit, and plot the second point. Connect the dots, and you have the second line. It should look like this:

R^2
Answer by MathGuyJoe(20)   (Show Source): (Show Source):
You can put this solution on YOUR website! To graph a line, all you need are two (x,y) points.
For your first equation:
 , substitute in a few numbers for x and see what you get for y: , substitute in a few numbers for x and see what you get for y:
If x = 0, then y = 3(0) = 0. That gives us the point (0, 0).
If x = 2, then y = 3(2) = 6. That gives us the point (2, 6).
Now we can plot those points and draw the line through them:

For your other equation:
 , substitute in a few numbers for x and see what you get for y: , substitute in a few numbers for x and see what you get for y:
If x = 0, then y = -(0) + 4 = 4. That gives us the point (0, 4).
If x = 2, then y = -(2) + 4 = 2. That gives us the point (2, 2).
Now we can plot those points and draw the line through them:

Hope this helps. ~ Joe
|
|
|