Question 1187725: Your mother is planning a menu for your birthday. She plans to serve pork barbecue and chicken nuggets. She expects to serve at least 50 kilos of meat. The pork (p) costs P200.00 per kilo and Chicken (c) for P180.00 She has a budget at most P10 000 for meat on your birthday
a. write the system of linear inequality that represents the problem
b. graph the system of linear inequalities
c. in what quadrant should your graph be for the solution of the system to make sense? explain.
Answer by Theo(13342)   (Show Source): (Show Source):
You can put this solution on YOUR website! let x equal the kilos of pork.
let y equal the kilos of chicken.
you have the following constraints.
the kilos of meat must be greater than or equal to 50.
the inequality to represent that is x + y >= 50
the cost for pork is 200 per kilo and the cost for chicken is 180 per kilo.
the total cost must be less than or equal to 10,000.
the inequality to represent that is 200x + 180y <= 10000
you have additional constraints in that the number of kilos of meat can't be negative.
your constraint inequalities are:
x + y >= 50
200x + 180y <= 10000
x >= 0
y >= 0
using the desmos.com calculator, you would grpah the opposite of these inequalities.
the area of the graph that is not shaded is your region of feasibility.
any coordinate points in that area will satisfy the constraints of the problem.
to illustrate, i used the coordinate point of (12,40).
the coordinate points are in (x,y) format.
x is the number of kilos of pork.
y is the numb of kilos of chicken.
i also used the coordinate points of (0,55.556) and (50,0) to further illustrate.
the corner points of that area is where the minimum or maximum solution would lie, depending on what the objective function is.
in this case, you do not appear to have an objective function that you either want to minimize or maximize.
here's what the graph looks like.
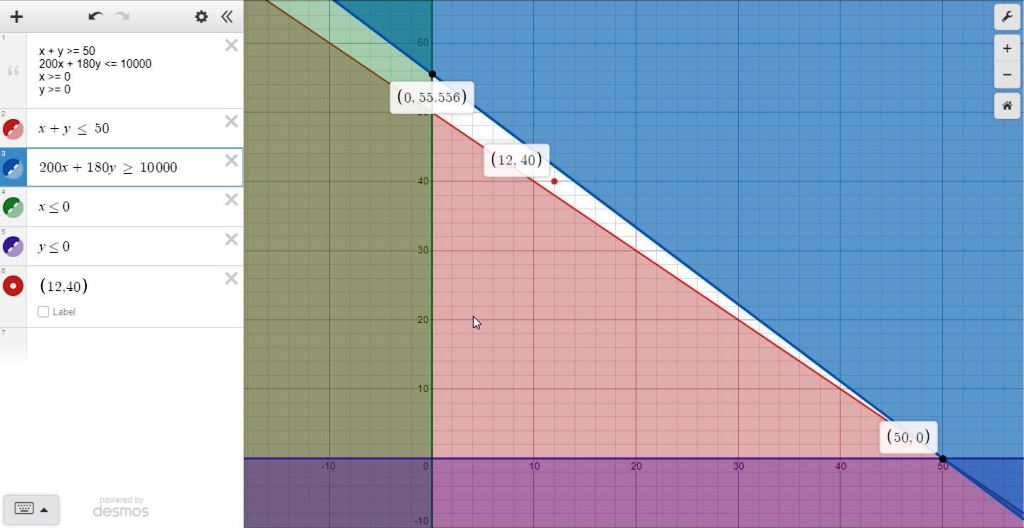
the coordinate points shown are:
(0,55.556)
(50,0)
(12,40)
a coordinate point not shown is (0,50)
that one is right below (0,55.556)
the points (0,55.556) and (50,0) and (0,50) are on the corner points of the feasible region.
since the constraint inequalities are <= ot >=, those points are also feasible, in addition to any point that is clearly in the feasible region, subh as the point (12,40).
if there were an objective function, it would be evaluated at the corner points, because they would contain the maximum or minimum value of the objective function.
all the constraints should be satisfied at any of the coordinate points in the feasible region.
the point (12,40) satisfies x + y >= 50 because 12 + 40 = 52.
that same point satisfies 200x + 180y <= 10,000 because 200 * 12 + 180 * 40 = 9600 which is less than 10,000.
the point (0,55.556) satisfies x + y >= 50 because 55.556 is greater than or equal to 50.
that same point satisfies 200x + 180y <= 10,000 because 180 * 55.556 = 10,000 which is less than or equal to 10,000.
note the graphical display is rounded to 3 decimal digits, so there might be a small discrepancy that wouldn't be there if the coordinate point were not rounded.
the point (50,0) satisfies x + y >= 50 because 50 + 0 = 50 which is greater than or equal to 50.
that same point satisfies 200x + 180y <= 10,000 because 200 * 50 = 10,000 which is less than or equal to 10,000.
if we assume you had an objective function, such as cost = 100x + 180y, it would be evaluated at each of the corner points to see which corner point gave the minimum cost.
(0,55.556) would lead to a cost of 10,000.
(50,0) would lead to a cost of 10,000.
(12,40) would lead to a cost of 9,800.
(0,50) would lead to a cost of 9,000.
the minimum cost solution would be at (0,50).
note that this was one of the corner points of the feasible region, which is where the maximum or minimum objective function value should lie.
your questions are answered below:
a. write the system of linear inequality that represents the problem
those are:
x + y >= 50
200x + 180y <= 10000
x >= 0
y >= 0
b. graph the system of linear inequalities
that was done above, using the desmos.com calculator that can be found at https://www.desmos.com/calculator
c. in what quadrant should your graph be for the solution of the system to make sense? explain.
the answer is restricted to quadrant 1.
that's because the value of x and y must both be greater than or equal to 0.
in quadrant 2, the value of x would be less than or equal to 0.
in quadrant 3, the value of both x and y would be less than or equal to 0.
in quadrant 4, the value of y would be less than or equal to 0.
only in the first quadrant are the values of x and y both greater than or equal to 0.
to further illustrate the feasible region, i chose a point outside of the feasible region to show you what happens.
the point (30,10) does not satisfy x + y >= 50 because 30 + 10 = 40 which is not greater than or equal to 50.
the point (30,10) does satisfy 200x + 180y <= 10,000 because 200 * 30 + 180 * 10 = 7800 which is less than or equal to 10,000.
the point (30,10) satisfied some of the constraints (200x + 180y) but not all of them (x + y).
since it did not satisfy all of the constraints, it was not a feasible solution.
it had to satisfy all of them to be a feasible solution.
|
|
|