Question 118247: I need to create a linear equation or inequality that could be used for analysis, prediction, or decision making. Then, I need to draw a graph to depict the variables. Here is the catch. Last week I had to come up with a real-life situation that follows a linear equation, with the independent variable being years. My topic was grocery prices and how they continually rise. I have to use grocery prices in my linear equation or inequality. I am so confused. Can you help me?
Answer by tutorcecilia(2152)   (Show Source): (Show Source):
You can put this solution on YOUR website! Let's use a linear equation for the increase in the average cost of grocery prices over years.
Let x = the years
Let y = grocery prices
.
Creating an imaginary scenario:
Over the past five years, the average cost of groceries has risen an average of $10 per year for the same type of groceries.
Year 2000 (x=0) = $100
Year 2001 (x=1) = $110
Year 2002 (x=2) = $120
Year 2003 (x=3) = $130, etc.
To find the linear equation, first identify any two points (x, y):
(0, 100) and (1, 110).
.
Next, find the slope between these two points:
Slope=m= =10 =10
.
Lastly, plug-in any point and slope into the slope-intercept formula: y-mx+b:
.
y=mx+b
100=(10)(0)+b [solve for the b-value]
100=0+b
100=b
so,
y=10x+100 [the equation of the line]
.
Now, you can pick any year, give it a sequential number (such as 2010 = x=10)and plug it into the equation. You can now predict average cost of groceries in the year 2010.
f(10)=(10)(10)+100
f(10)=$200
.
So in the year 2010, you can expect to spend $200 for the same amount of groceries that cost you only $200 in the year 2000.
.
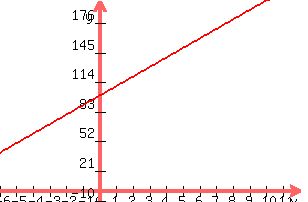
Analyzing the graph shows a steady increase in the cost of groceries. You can use the graph to help you budget for your families groceries in the future. You know that according to the graph, you will have to add an average of $10 per year for the increase in groceries in order to keep up with the rising cost.
.
Graphing y = 10x+100
.
|
|
|