Question 1123693: The equation y = 12x describes the amount of money Louis earns, where x is the number of hours he works
and y is the amount of money he earns.
The table shows the amount of money Carl earns for different numbers of hours worked.
Carl�s Earnings
Time (h) 3 5 8 10
Money earned
($) 45 75 120 150
(a) How much money does Carl earn per hour? Show your work.
(b) Who earns more per hour? Justify your answer.
(c) Draw a graph that represents Carl�s earnings over time in hours. Remember to label the axes, I need help please, and thank you
Answer by josgarithmetic(39632)   (Show Source): (Show Source):
You can put this solution on YOUR website! ---
Carl�s Earnings
Time (h) 3 5 8 10
Money earned
($) 45 75 120 150
---
You can find the slope of that and this will be his wage rate.
Louis's rate is obviously 12 dollars per hour.
.............................More help was wanted...........................
Louis' earnings,

L(x), his earnings
x, number of hours worked
12, the slope of this linear equation; so this means  . .
Carl's earnings,
C(x), his earnings
x, number of hours worked
(x, C(x)) points: (3, 45), (5, 75), (8, 120), (10, 150).
Hopefully this forms all one single slope from point to point.

-

-

-
C(x) ---(part deleted)---- Carl obviously gets a rate of  ---(part deleted)----. ---(part deleted)----.
If you work with Carl's data further, you will find also y-intercept is 0.
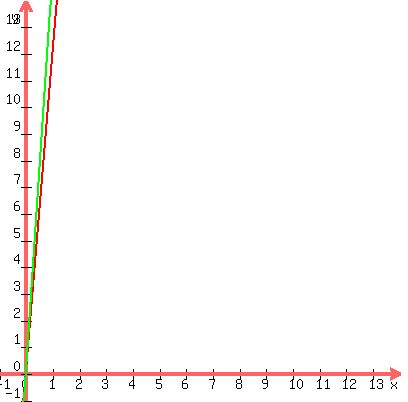
(for the graph: red for Louis, green for Carl)
(Colors here not related to the graph: Louis  , Carl , Carl  ) )
|
|
|