Question 1109406: How would you graph the following?
2x+3y <18
3x-y =/< 6
y =/> 0
x=/> 0
Answer by MathLover1(20850)   (Show Source): (Show Source):
You can put this solution on YOUR website! 1. 
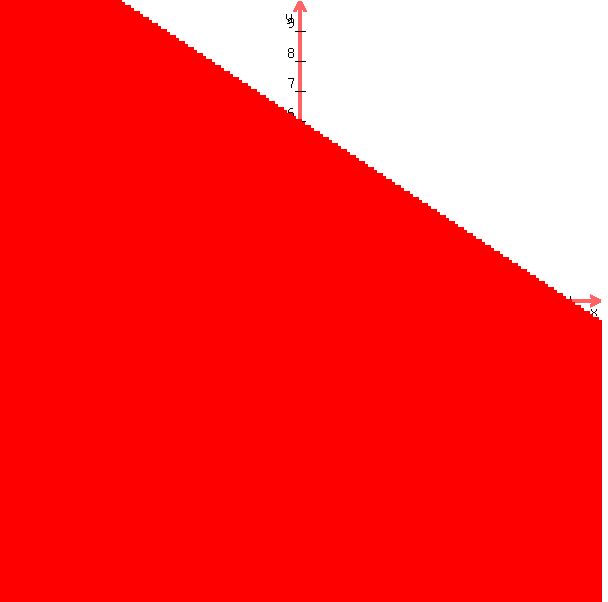
to graph the following inequality, first draw the line and decide which side to shade for the required region
Explanation:
Treat the inequality as an equality or as a straight line graph first. Then shade the correct side of the line to indicate the solutions which are less than  . .
You can use any method to draw the straight line - plot points or use the intercept/gradient method.
I will use the method of the  and and  intercepts. intercepts.
To find the -intercept, make  : :


 => -intercept is at ( => -intercept is at ( , , ) )
To find the -intercept, make 


 => -intercept is at (, => -intercept is at (, ) )
Now that you have both intercepts you can plot them and draw a solid line through them. This is the line .
You could also write the equation as : 

To decide which side of the line to  , choose a test point. , choose a test point.
(,) is a good one to test:
since given: , you have
 => =>  is is 
so, (,) is in the required region and the area BELOW the line must be shaded
2.  ...do it same way ...do it same way
intercepts:
 ...set ...set

 => -intercept is at ( => -intercept is at ( ,) ,)
...set

 => -intercept is at (, => -intercept is at (, ) )
graph: or 

since given solution is a line and all points to the left and above the line

3.
 -> here you have graph shaded above -axis including -axis -> here you have graph shaded above -axis including -axis

4.
 -> here you have graph shaded starting with -axis including everything to the right -> here you have graph shaded starting with -axis including everything to the right

|
|
|