Question 1043722: the temperature was 72 degrees F and then it dropped 2 degrees per hour for the next eight hours, use the table below to graph the line.
Time: 1, 2, 4, 6, 8 Temperature: 70, 68, 64, 60, 56
Found 2 solutions by tampham5396, Boreal:
Answer by tampham5396(3)   (Show Source): (Show Source):
Answer by Boreal(15235)  (Show Source): (Show Source):
You can put this solution on YOUR website! The intercept is at 72 degrees where t=0
The slope is -2 degrees/hour, because after 1 hour, it is 2 degrees less, after 2 hours, 4 degrees less, after 4 hours, 8 degrees less.
y=-2x+72
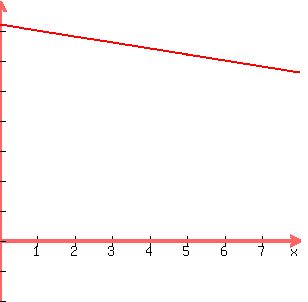
Tick marks are 10 degrees on the y-axis and 1 hour on the x-axis.
|
|
|