|
Question 88740: Not sure how to explain this: - completely confused
f(x)=[x3 x<1
[-1/2x2 +1.5 x>=1
Okay need to capture the equation from the [y=] then using graphing calculator make visual graphs for each compound function!!! - I havae no clue what this is talking about - OMG
HELP!!
Answer by bucky(2189)   (Show Source): (Show Source):
You can put this solution on YOUR website! What this problem is telling you is:
.
First on the graph, for values of x that are less than 1 (that is, for values to the left
of +1 on the x-axis) the graph is the graph of  . .
.
Next on the graph, for values of x that are greater than 1 (that is, for values at or to
the right of +1 on the x-axis, the graph follows the path of the graph of  . .
.
Let's begin by graphing . This graph is:
.
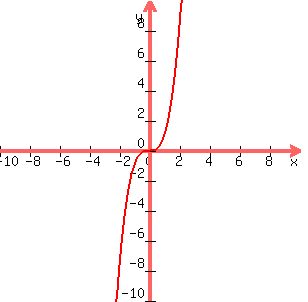
.
Since this graph only applies for values of x that are less than +1, imagine that you take
an eraser and wipe out that part of the graph that goes upward above the values of y = 1
so that the graph looks like:
.

.
Next let's graph . This graph is:
.

.
But this graph only applies when the value of x is 1 or is greater than 1. So imagine
that you erase that part of the graph where x is to the left of +1. After the erasure the
graph would look like:
.

.
Now let's put both graphs on the same set of coordinate axes.
.

.
The "combined" graph that is the answer you need is that graph that follows the red part
until x is just barely less than 1. That is, the graph that rises from minus infinity,
goes through the origin and then rises to the point where x is just less than -1 and y is
just less than -1. (For this problem, that point appears to be where the red and green graphs
intersect.) After that point, as x gets more positive the graph that is the answer you
are looking for follows the green path, going downward, crossing the x-axis where x is
approximately +1.73, and continuing down toward minus infinity in the y direction.
.
So, in summary, what you do for this problem is to find the appropriate pieces of two
graphs and visualize them as one "put together" graph. Note that in other problems you
will encounter, the two pieces may not intersect as they do in this problem. Where they
approach each other there may be a "jump" in y values which means the two graphs are not
continuous. In this problem, they are continuous, so the resulting graph looks a little nicer.
.
Hope this helps you to understand what the problem is asking for you to do.
.
|
|
|
| |