|
Question 1142992: A lechon manok store has an average of 5000 customers per week and sells for 225 pesos per whole-grilled chicken. Because of increased labor and production cost, the store owner needs to increase the price of grilled-chicken. The owner is aware of the results of the survey that each 10 pesos increase in price, the number of customers decreases by 12.
a. Write a function rule that describes the reduced number of customers after the increase in price.
b. How much income would be realized by the owner if he decides to increase the original price to 225 pesos?
Answer by Theo(13342)   (Show Source): (Show Source):
You can put this solution on YOUR website! let x equal the number of increments to the number of customers and the number of increments to the cost per grilled chicken.
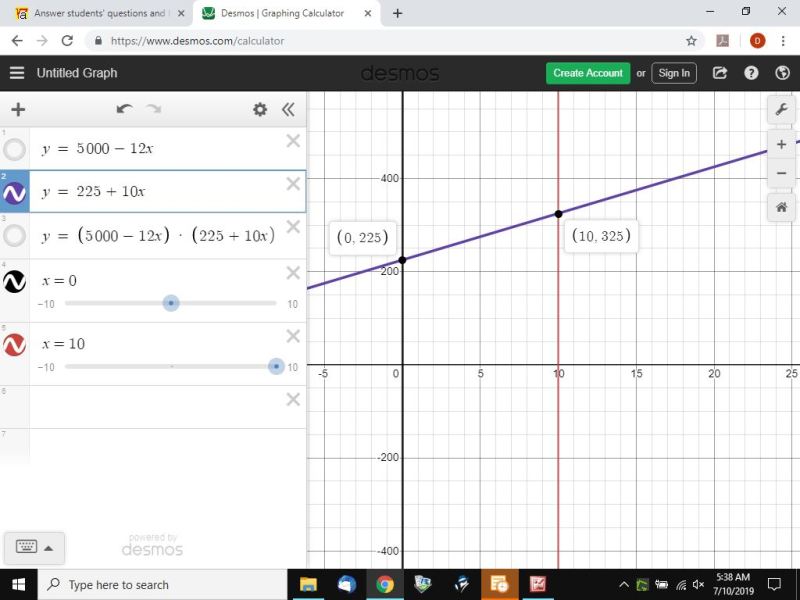
each increment of the price increase is modeled by 225 + 10x.
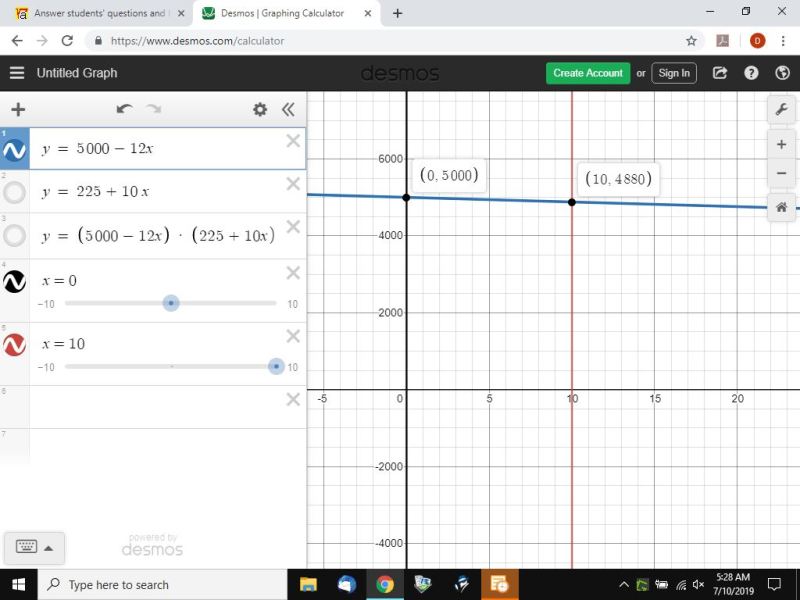
each increment of the number of customers decrease is modeled by 5000 - 12x.
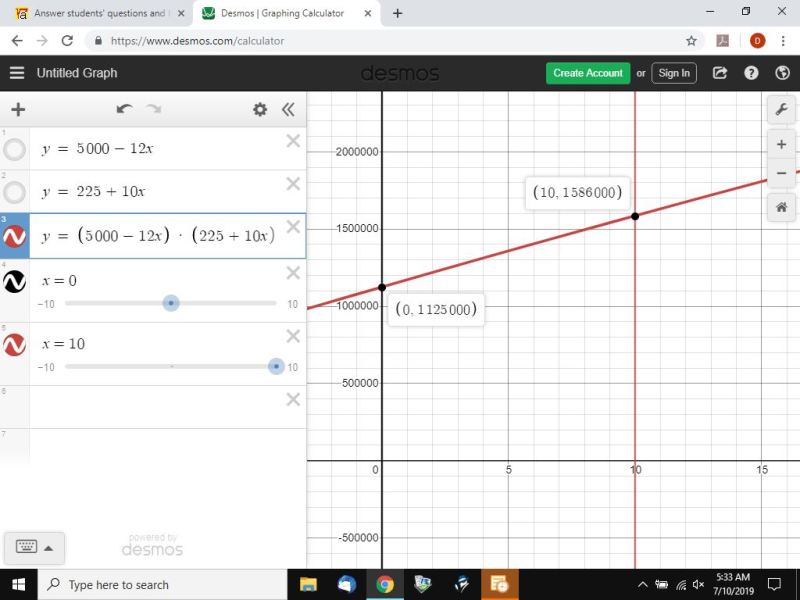
the total income is represented by the equation of y = (5000 - 12x) * (225 + 10x).
when x = 0, the number of customers is 5000 and the price per grilled chicken is 225 pesos and the total income is equal to 5000 * 225 = 1,125,000 pesos.
when x = 1, the number of customers is 5000 - 12 = 4988 and the price per grilled chicken is 225 + 10 = 235 pesos and the income is equal to 4988 * 235 = 1,172,180 pesos.
you stated the original price is 225 pesos, and then you ask what the income would be if you increase the price to 225 pesos.
this obviously an error, since the increase as stated would be equal to 0.
despite that, the equation for the change in customers and the change in price is valid and you can plug any number of increments of x in the equation to get what you want.
for example, if the price is increased to 325 pesos, then 325 - 225 = 100 / 10 = 10 increments of x.
the number of customers would then be 5000 - 12 * 10 = 5000 - 120 = 4880.
the price would then be 225 + 10 * 10 = 325 pesos per grilled chicken.
the total income would then be 4880 * 325 = 1,586,000 pesos.
while you can solve this without graphing, the graphing of the functions allows you to see what happens visually.
the following graphs show you what i mean.
first graph is the demand function.
second graph is the price function.
third graph is the income function.
|
|
|
| |