Start with the given system of equations:


In order to graph these equations, we need to solve for y for each equation.
So let's solve for y on the first equation
Start with the given equation
 Subtract Subtract  from both sides from both sides
 Rearrange the equation Rearrange the equation
 Divide both sides by Divide both sides by 
 Break up the fraction Break up the fraction
 Reduce Reduce
Now lets graph (note: if you need help with graphing, check out this solver)
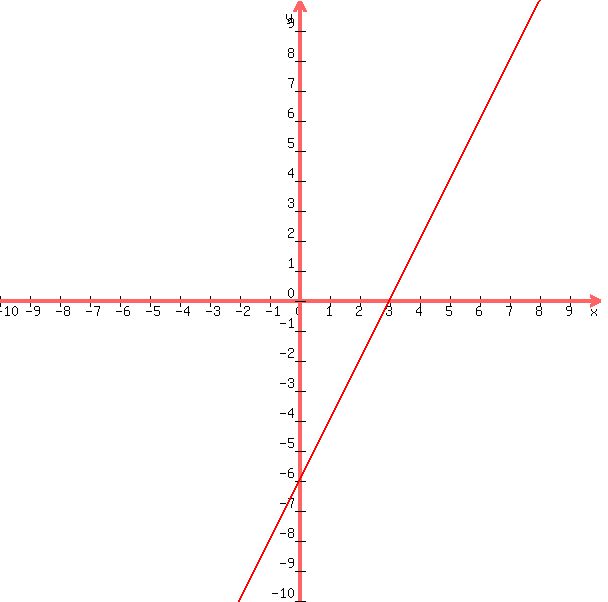 Graph of Graph of
So let's solve for y on the second equation
Start with the given equation
 Subtract Subtract  from both sides from both sides
 Rearrange the equation Rearrange the equation
 Divide both sides by Divide both sides by 
 Break up the fraction Break up the fraction
 Reduce Reduce
Now lets add the graph of to our first plot to get:
 Graph of (red) and (green) Graph of (red) and (green)
From the graph, we can see that the two lines intersect at the point (, ) (note: you might have to adjust the window to see the intersection) ) (note: you might have to adjust the window to see the intersection) |


 (
(