|
Question 227638: How do I find the plotting points and the the y-intercept?
y=4/3x+2
Found 2 solutions by jim_thompson5910, drj:
Answer by jim_thompson5910(35256)   (Show Source): (Show Source):
Answer by drj(1380)  (Show Source): (Show Source):
You can put this solution on YOUR website! How do I find the plotting points and the the y-intercept

Step 1. First to draw this line, we need two points. Here, are Step-By-Step videos on how to plot the lines:
http://www.freedomuniversity.tv/courses/IntroAlgebra/Module3.html
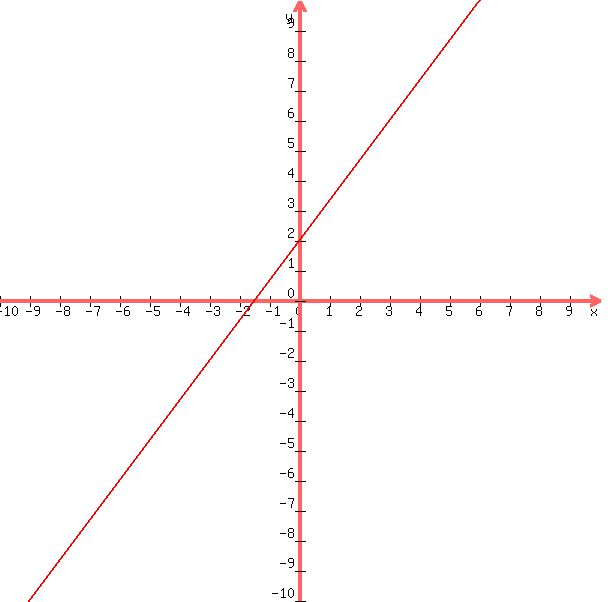
Step 2. This equation is in slope-intercept form given as y=mx+b where m is the slope and b is the y-intercept when x=0 or at point (0,b). So in this example the slope is  and the y-intercept is and the y-intercept is  when x=0 or at point (0,2). We have the y-intercept as one point at (0,2). when x=0 or at point (0,2). We have the y-intercept as one point at (0,2).
Step 3. To plot other points choose a value of x and then find y. For example, let x=3, then for the equation then y=4*3/3+2=6. So one point is (3, 6).
Step 4. Now we have two points (0,2) from Step 2 and (3,6) from Step 3 to draw our line. The graph of the line using these points is shown below
 . .
I hope the above steps were helpful.
For free Step-By-Step Videos on Introduction to Algebra, please visit http://www.FreedomUniversity.TV/courses/IntroAlgebra or for Trigonometry visit http://www.FreedomUniversity.TV/courses/Trigonometry.
And good luck in your studies!
Respectfully,
Dr J
http://www.FreedomUniversity.TV
http://www.Facebook.com/FreedomUniversity.TV
http://www.Twitter.com/FreedomUTV
|
|
|
| |