|
Question 129828: How do you graph y=x+2 and y=-2x+2
Found 3 solutions by MathLover1, solver91311, somuahkata@gmail.com:
Answer by MathLover1(20855)   (Show Source): (Show Source):
Answer by solver91311(24713)  (Show Source): (Show Source):
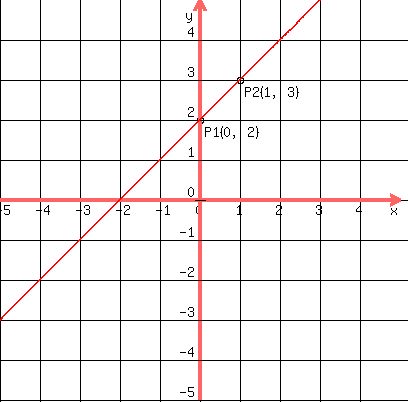
You can put this solution on YOUR website! You need two points to define a line (no more and no less), so pick a value for x, put it into the equation, determine the value for y that corresponds, and then plot the point with the x-coordinate of the value you picked and the y-coordinate for the value that resulted from your choice. Then do it again for a different value of x. Once you have plotted two points, draw a line through them and you are done.
Since you can choose any value you like for x, pick something that will make the arithmetic simple. 0 is always a good choice.


So our first point is (0,2), because we chose 0 for x, and that resulted in 2 for y.
Let's try x = 1


So the second point is (1,3), because we chose 1 for x, and that resulted in 3 for y.
Plot the points:

Then draw the line:
Follow this same procedure for the other equation.
Answer by somuahkata@gmail.com(7)  (Show Source): (Show Source):
You can put this solution on YOUR website!
Using the intercept method, when x = 0 and when y = 0
For
y = x + 2
When x = 0
y = 0 + 2
y = 2
Point (0,2)
When y = 0
0 = x + 2
x = - 2
Point (-2,0)
y = -2x + 2
When x = 0
y = -2 (0) + 2
y = 2
Point (0,2)
When y = 0
0 = -2x + 2
2x = 2
x = 1
Pont (1,0)
Plot these points and draw your graph
 (graph 300x200 pixels, x from -6 to 5, y from -10 to 10, of TWO functions x^2 and x^2/10-x) (graph 300x200 pixels, x from -6 to 5, y from -10 to 10, of TWO functions x^2 and x^2/10-x)
|
|
|
| |