Question 1170138: When you rent a car from Rental Agency A, for one day there is a base fee of
$20 and you pay $0.15 for each mile you drive. At Rental Agency B you pay a
base fee of $30 and get 100 miles free. Every mile after is $0.25 per mile.
1
Write a formula for the rental cost (C) in
terms of the miles (m) driven, for Agency A
and graph it.
2
Write a formula for the rental cost (D) in
terms of the miles (n) driven, for Agency B
and graph it.
3 What is the slope of the line from 100 miles
onward in the graph for Agency B?
4 Graph the formula for Agency A.
5 How many miles can you drive with $100,
Answer by Theo(13342)   (Show Source): (Show Source):
You can put this solution on YOUR website! equation for agency A is:
c = 20 + .15 * m
c is the total cost for the rental.
m is the number of miles driven
cost for agency B is:
c = 30 if the rental is less than or equal to 100 miles.
c = 30 + .25 * (m-100) if the cost is more than 100 miles.
graphing software can't really handle split graphs like the one for agency B.
because of that, i split the graphs into two pieces.
something like that needs to be done manually.
because of that, created two mechanically generated graphs.
one graph is for 0 to 100 miles and the other graph is for over 100 miles.
these graphs have the costs for both agencies on the same graph.
i could, and i will, generate a manual graph, right after, just to show you the graph can be done and what it might look like.
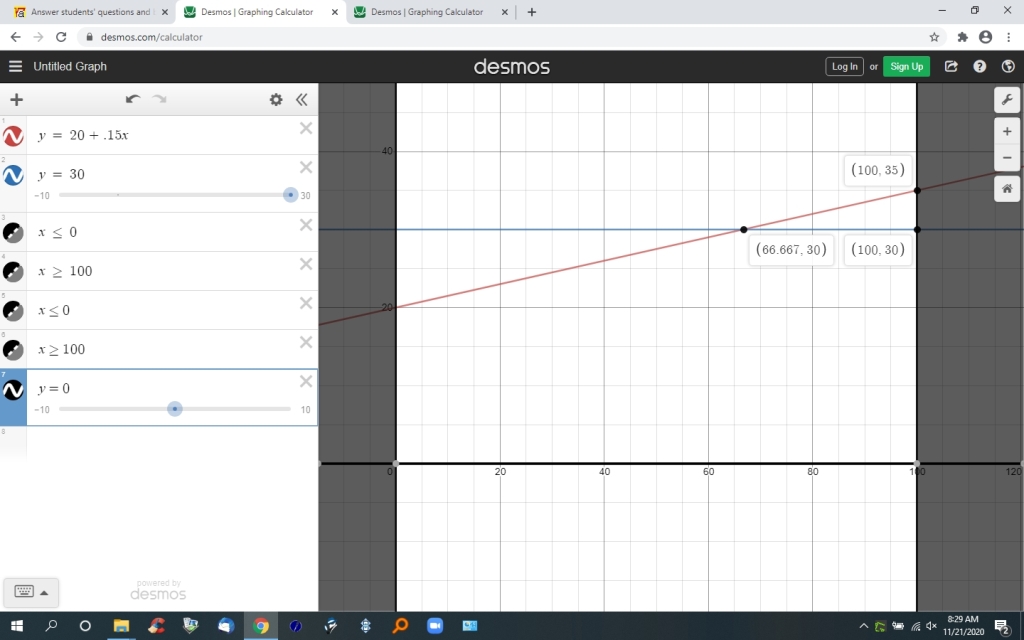
here's my first graph for 0 to 100 miles.
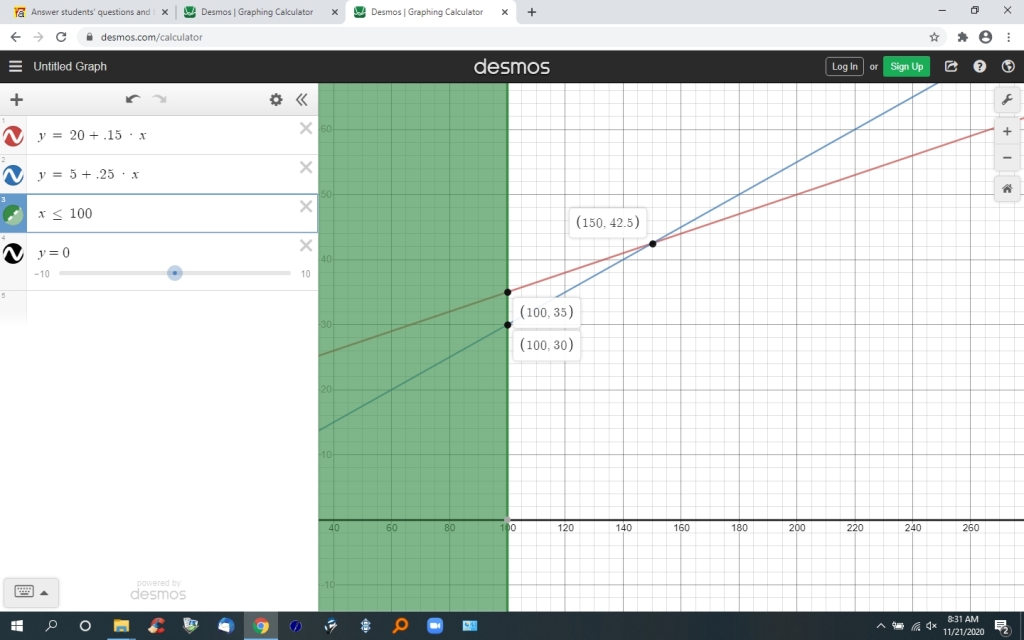
here's my second graph for 100 and up miles.
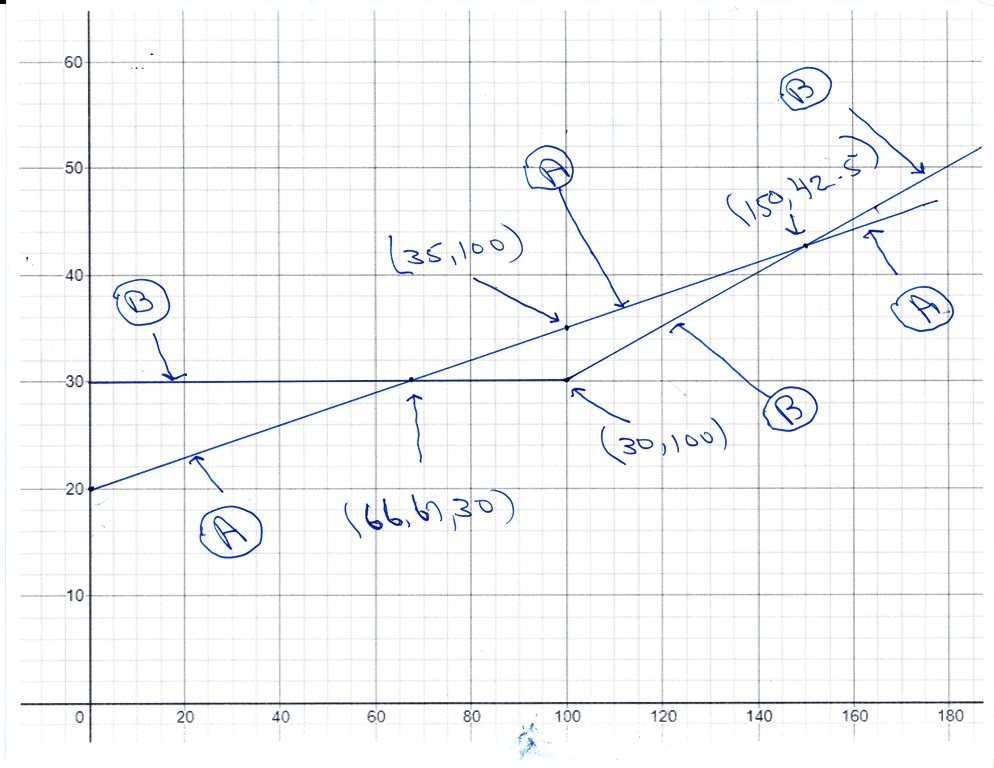
here's my third graph, manually generated, for 0 and up miles.
the first graph shows you that, before 66.67 miles, agency A rental is cheaper, and that, after 66.67 miles agency B is cheaper.
the costs at 66.67 miles are the same, so that's a break even point when the miles traveled is below 100.
agency A graph is in red.
agency B graph is in blue.
the graph also shows you that, at 100 miles, the cost for agency A is 35 dollars while the cost for agency B is 30 dollars.
the second graph shows you that, at 100 miles, the cost for agency A is 35 dollars while the cost for agency B is 30 dollars.
this is the same as on the first graph, which it should be, because 100 miles is a common point between the two graphs.
agency A graph is in red.
agency B graph is in blue.
the graph also shows you that, below 150 miles, agency B is cheaper, while above 50 miles agency A is cheaper.
the cost is the same at 150 miles, so that's a break even point when the miles traveled is above 100.
the third graph is manually generated.
the graph is all in black.
because of that, i labeled the lines at the appropriate points.
you can see that, below 66.67 miles, agency A cost is lower and above 66.67 miles up to 150 miles, agency B cost is lower, and that, above 150 miles agency A cost is lower again.
that pretty much tells the whole story in one graph, but, it might be a little harder to follow.
below, your questions will be answered, except for the graphs, which have already been shown.
1 - Write a formula for the rental cost (C) in terms of the miles (m) driven, for Agency A.
formula for agency A is C = 20 + .15 * m
C is the total cost
m is the number of miles driven.
2 - Write a formula for the rental cost (D) in terms of the miles (n) driven, for Agency B.
formula for agency B is D = 30 when the number of miles driven is less than or equal to 100 and D = 5 + .25 * n when the number of miles driven is more than 100.
the derivation of the cost for over 100 miles is shown below:
over 100 miles, the cost for B would be D = 30 + .25 * n - .25 * 100)
simplify this to get D = 30 + .25 * n - 25
combine like terms to get D = 5 + .25 * n
3 - What is the slope of the line from 100 miles onward in the graph for Agency B?
the slope of the line for 100 miles onward for agency B is .25.
this is because, for every additional unit in the value of x, there is an additional .25 units in the value of y.
for example, when we use the formula of D = 5 + .25 * n for agency B, ....
when x = 100, the cost for agency B is 5 + .25 * 100 = 30.
when x = 101, the cost for agency B is 5 + .25 * 101 = 30.25
x went up 1 unit and y went up .25 units.
4 Graph the formula for Agency A.
done for A and B on the same graph as shown above.
5 How many miles can you drive with $100.
with agency A, the cost is C = 20 + .15 * m
when C = 100, the equation becomes 100 = 20 + .15 * m.
subtract 20 from both sides of the equation to9 get:
80 = .15 * m
solve for m to get:
m = 80 / .15 = 533 and 1/3 miles.
with agency B, the cost for the first 100 miles is 30 and the cost for the additional miles over 100 is .25 * m
the easiest way to charge for this is to give the customer a credit for the first 100 miles at .25 per mile and then charge the difference.
from above, the formula for the miles over 100 is 5 + .25 * m.
that formula includes the credit for the first 100 miles at .25 a mile.
therefore, the charge to the customer D = 5 + .25 * m
when D = 100, the equation becomes 100 = 5 + .25 * m
subtract 5 from both sides of the equation to get:
95 = .25 * m
solve for m to get:
m = 95 / .25 = 380 miles.
to see if this is correct, take 100 off the miles to get 280 miles.
those will be charged at .25 per mile for a variable cost .25 * 280 = 70 dollars.
add the 30 dollars up front cost for a total cost of 100 dollars.
that's the 30 dollars up front cost plus the 70 dollars for the miles driven over 100.
the 30 dollars up front cost is a fixed cost because the cost is the same regardless of the number of miles driven.
the cost for the additional miles over 100 is the variable cost because it varies with the number of miles driven.
agency A also has a fixed cost and a variable cost.
the fixed cost for agency A is the 20 up front cost.
the variable cost for agency A is the .15 per mile driven.
take away all the words, and the answer for question 5 is:
533 and 1/3 miles can be driven for 100 dollars with agency A.
380 miles can be driven for 100 dollars with agency B.
|
|
|