Question 1117091: This is Linear Programming Pls help us! :(
please use 2 variables only x and y thank you
MILESTONE: Linear Program
After making various presentations to potential investors, MC has finally hit the jackpot. An investor wants to invest 100,000,000 pesos in MC.
After doing all your staff work in the previous weeks, the two of you have been tasked to find the most efficient way to invest the money. This involves making the highest profit possible from the money you have invested. You have decided to consult your friend Olivia, who is also a financial investor.
Olivia discusses that you need to use a mathematical method called Linear Programming to solve this problem. She explains that Linear Programming is a method that has to be set up very carefully. It involves creating a function to optimize and modelling various constraints using linear equations. She has decided to present you the profitability percentages of MC, given that she has already done prior work with MC.
The startup arm is projected to return at least 12%. To minimize risk, you must invest no more than 30,000,000 pesos. The financial stocks return 3%, while the retail arm returns 5%.
For tax reasons, you must invest at least 3 times more in the financial stocks than the retail arm.
Your task is to set up the linear program. You have to define the following:
1. The variables that will be used
2. The optimization function that will be used
a. What kind of optimization will be done: minimization or maximization?
3. The constraints that the linear program will be subjected to
Found 3 solutions by Theo, KMST, ikleyn:
Answer by Theo(13342)   (Show Source): (Show Source):
You can put this solution on YOUR website! i solved this before using 3 variables.
the only way i can see to solve this using 2 variables is to eliminate the 30 million that will be invested in the startup arm since it's clear that the maximum of 30 million invested in the startup arm is the way to go because the 12% return is way higher than the return of the other two.
so, assuming there is a maximum investment of 30 million in the startup arm, then there is a maximum of 70 million available for the other two investment opportunities.
that reduces your variables to x and y.
x is the amount invested in the financial stocks.
y is the amount invested in the retail arm.
the financial stocks will return 3%.
the retail arm will return 5%.
your objective function is therefore .03x + .05y.
this is the amount of profit you want to maximize.
your constraints are:
x + y <= 70 million.
this is because the maximum you can invest is 70 million, since you are investing 30 million in the startup arm.
x >= 3y.
this is because you need to invest at least 3 times as much in the financial stocks as you invest in the retail arm for tax purposes.
x >= 0
y >= 0
this is because the amount invested in each can't be less than 0.
since there are only 2 variables involved, this can be solved graphically.
to answer your questions:
1. The variables that will be used.
the variables that will be used are x and y.
2. The optimization function that will be used
profit = .03x + .05y
a. What kind of optimization will be done: minimization or maximization?
maximization.
3. The constraints that the linear program will be subjected to.
x + y <= 70 million.
x >= 0
y >= 0
x >= 3y
i solved this graphically in the following manner.
your constraint functions are:
x + y <= 70 million.
x >= 0
y >= 0
x >= 3y
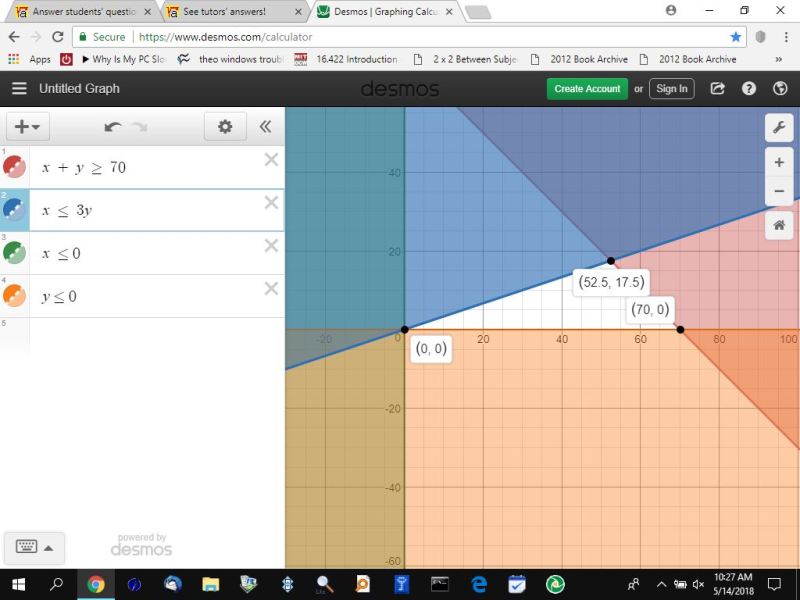
i graphed the OPPOSITE of these constraints, as shown below:
x + y >= 70 million.
x <= 0
y <= 0
x <= 3y
the area of the graph that is NOT shaded is the region of feasibility.
the corner points of the region of feasibility will provide the x and y values for where the maximum profit will be located.
the profit equation is evaluated at each of these corner points.
the maximum profit is found to be at the point (52.5, 17.5).
at this point, the profit is 52.5 * .03 + 17.5 * .05 = 2.45 million.
all constraints have to be satisfied also.
52.5 + 17.5 = 70 million which is less than or equal to 70 million, so this constaint is satisfied.
x and y both have to be greater than zero, therefore this constraint is satisfied.
x has to be greater than or equal to 3 times y.
52.5 / 17.5 = 3, so this constraint is satisfied.
the solution satisfies all constraints and the profit is greater at this corner point than at any of the other corner points, so the solution is assumed to be good.
if you still have the solution i provided earlier, you will see that this solution is consistent with that solution, except that i eliminated consideration of the 30 million for the startup arm.
this had to be done in order to reduce the number of variables to two, which appears to be what your requirement was.
here's my graph.
the graphing software i used is at https://www.desmos.com/calculator
note that this software allows the use of the method i chose.
not all graphing software can do that.
usually you have to graph the equality portion of the constraint functions then manually find the area of the graph that satisfies all of those constraints.
in that case, you would probably want to solve for y in each of those equations and then graph the equality portion of those equations.
x + y <= 70 becomes y <= 70 - x
x >= 0 remains the same
y >= 0 remains the same
x >= 3y becomes y <= x/3
you would then graph:
y = 70 - x
x = 0
y = 0
y = x/3
you would then shade the area that satisfies the inequality equations.
in that case, the shaded area of the graph will be the area that is NOT shaded in my graph.
here's what that would look like.
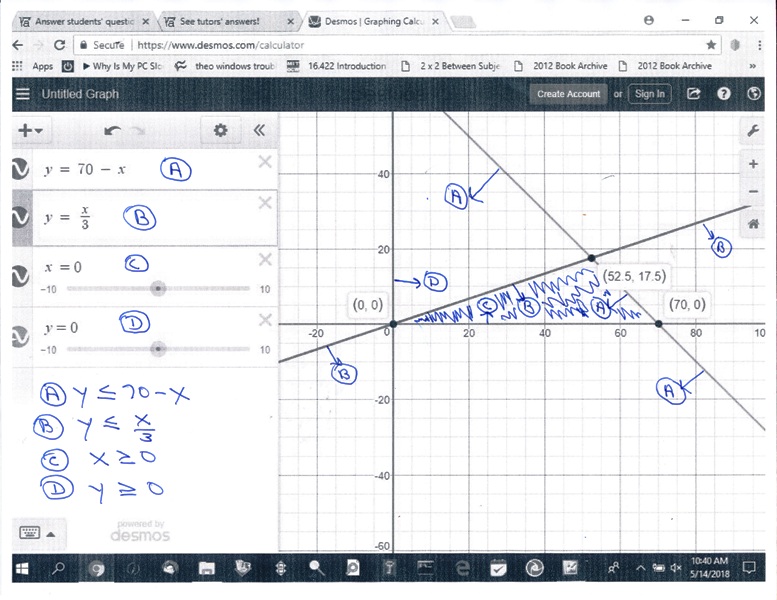
the region that is shaded in this graph is the area of the graph that satisfied ALL of the constraints.
you can see that the region of feasibility is the same.
the only difference is the method used to find it.
Answer by KMST(5328)  (Show Source): (Show Source):
You can put this solution on YOUR website! I already answered this question recently (hopefully from a student unknown to you) as question number 1116231.
A copy of my previous answer  is attached below. is attached below.
NOTES: Sometimes you can locate an answer to the same question using a phrase from the question in an internet search.
If you do not like my answer to a question and are going to re-post it for a second opinion, just let me know through a thank you note, and I will leave the question for someone else to answer.
THE PROBLEM:
If I understand the story, there are 3 different investments being considered:
A) a financial stocks investment that returns 3%,
B) a slightly more risky retail company investment that returns 5%, and
C) a new, startup company that is expected to return 12%, but is the riskiest choice.
Because of the risk, you want to invest no more than 30,000,000, pesos in option C),
and to balance risk between options A) and B),you want to invest at least 3 more times in A) than in B).
THE EXPECTED ANSWER:
1. The variables that will be used
 = amount invested in B), the retail company, in pesos. = amount invested in B), the retail company, in pesos.
 = amount invested in A), the financial stocks, in pesos. = amount invested in A), the financial stocks, in pesos.
2. The optimization function that will be used
 = the profit returned by the mix of investments. = the profit returned by the mix of investments.
To figure out what the function "formula" is,
you multiply each amount invested times the percentage return expected (as a decimal),
and add the results.
 of pesos is of pesos is  pesos. pesos.
 of pesos is of pesos is  pesos. pesos.
The amount to be invested on C), the "startup arm" is
 , and the , and the  profit expected from that investment is profit expected from that investment is
 . .
So  , which simplifies to , which simplifies to

2a. What kind of optimization will be done: minimization or maximization?
Do we want to maximize profit or to keep it to a minimum?
We want  , of course. , of course.
3. The constraints that the linear program will be subjected to
We do not invest negative amounts, and that gives us the constraints
 , ,
 , and , and
 <--> <--> 
We are told not to invest more than 30,000,000 in risky option C, so
 <--> <--> 
is another "constraint".
The advice to invest "at least 3 times more in the financial stocks than the retail arm" translates into the constraint
 . .
4. Although you did not ask, you would graph the "feasible region" determined by your constraints as the quadrilateral ABCD below.

The blue line is  . The points on that line and those above the line satisfy constraint . The points on that line and those above the line satisfy constraint  . .
The red line, with equation   , ,
and the points below it satisfy  . .
The green line, with equation  and the points above it satisfy and the points above it satisfy  . .
The points in the first quadrant, including the origin and the positive x- and y-axes satisfy the constraints  and and  . .
The points inside and on the border of quadrilateral ABCD satisfy all constraints and are the feasible region.
5. Although you did not ask, each profit value of  graphs as a staring line. graphs as a staring line.
For example,
 <--> <-->  and and
 <--> <--> 
graph as the black slanted lines shown below.

All such lines have the same  slope, so they are parallel, slope, so they are parallel,
with a profit of  pesos represented by the upper line shown, and a profit of pesos represented by the upper line shown, and a profit of  pesos represented by the lower line. pesos represented by the lower line.
As the profit increases the line slides down, parallel to itself,
but the lower line is outside the feasible region,
failing some of the constraints.
It is obvious that in this case, the maximum profit will happen at point A,
as a fifth grader could tell you without much math.
With this type of problem, the lines for constant optimum value slide until they get to a corner or an edge of the feasible region.
That is why your teacher will tell you to calculate the value of the optimization function at all corners of the feasible region to find the optimum value of the function and the conditions (x and y) that produce that optimum value.
 (added calculations): (added calculations):
For point  , the coordinates are , the coordinates are  , the solution to , the solution to
 . .
That means investing  pesos on the retail company, pesos on the retail company,
 pesos on financial stocks, and nothing on the startup. pesos on financial stocks, and nothing on the startup.
and the value of the optimization function is
 , ,
meaning a profit of  pesos. pesos.
For point  , the coordinates are , the coordinates are  , the solution to , the solution to
 . .
That means investing  pesos on the retail company, pesos on the retail company,
 pesos on financial stocks, and pesos on financial stocks, and  on the startup. on the startup.
and the value of the optimization function is
 . .
If you choose point  , with , with  , ,  , ,
you are investing all  on financial stocks, on financial stocks,
for a profit of  pesos. pesos.
If you choose point  , with , , with ,  , ,
you are investing  pesos on financial stocks, pesos on financial stocks,
and pesos on the startup,
for a profit of  pesos. pesos.
THE FIFTH-GRADER SAYS:
Obviously, you want to invest as much as possible where you get the most profit,
so you should be aggressive and invest 30,000,000, pesos in option C).
For the remaining 100,000,000-30,000,000=70,000,000 pesos,
you want to invest as much as possible in B),
but since they advise to invest at least 3 more times in A) than in B),
you split that 70,000,000 pesos into four equal parts,
invest 1/4 (17,500,500 pesos) in B),
and the other 3/4 (52,500,000 pesos in A).
You expect to earn
12% of 30,000,000 pesos (3,600,000 pesos) from C),
5% of 17,500,000 pesos (875,000 pesos from B), and
3% of 52,500,000 pesos (1,575,000 pesos from A),
for a total return of 6,050,000 pesos
(6.05% of your 100,000,000 investment),
which is the maximum profit predicted.
End of story.
THE MORE IMPRESSIVE EXPECTED GROWN-UP RESPONSE:
You produce a slide presentation with lots of color, music, and inspirational pictures.
You show tables of data with marketing studies' results backing up the projected 12% return for the new startup company.
You present expert opinions backing up the investment constraints advice.
You throw in jargon financial terms,
mention linear programming as an important mathematical tool,
and present the answers to the problem questions,
with all possible mathematical terms and graphs.
Your mesmerized audience congratulates you on your analysis on how to maximize profits.
You get a promotion,
and the fifth grader maximizes the number of chocolate chip cookies that can be swiped from the board room table.
Answer by ikleyn(52944)  (Show Source): (Show Source):
|
|
|