What you are trying to do here is to find relative maximum
and relative minimum point on a graph:
Here is the graph of

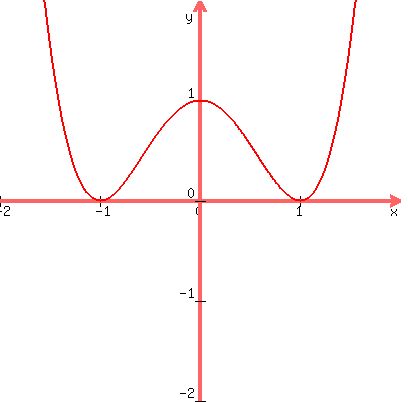 You can see the answer by looking at the graph. There is a
relative maximum point at (0,1) (where x=0) and relative minimum
points (-1,0) and (1,0) (where x=-1 and where x=1).
However "looking and seeing" is not acceptable. You must use
calculus.
The derivative when evaluated at a point tells us whether a graph
at that point is increasing (going up to the right) or decreasing
(going down to the right) or neither (when it is at a relative
minimum or maximum.
We find the critical points by finding the derivative and setting it
equal to 0.
You can see the answer by looking at the graph. There is a
relative maximum point at (0,1) (where x=0) and relative minimum
points (-1,0) and (1,0) (where x=-1 and where x=1).
However "looking and seeing" is not acceptable. You must use
calculus.
The derivative when evaluated at a point tells us whether a graph
at that point is increasing (going up to the right) or decreasing
(going down to the right) or neither (when it is at a relative
minimum or maximum.
We find the critical points by finding the derivative and setting it
equal to 0.

 We set that = 0:
 4x=0; x^2-1=0
x=0; (x-1)(x+1)=0
x-1=0; x+1=0
x=1; x=-1
So the critical points (candidates for the x-coordinates
of relative maximums and minimums).
Now we make this chart:
Interval | x < -1 | -1 < x < 0 | 0 < x < 1 | x > 1
-----------------------------------------------------------------
Test value? | -2 | -0.5 | 0.5 | 2
-----------------------------------------------------------------
Sign of f' | - | + | - | +
at test value? | | | |
-----------------------------------------------------------------
Increasing or |decreasing| increasing | decreasing|increasing
decreasing? |
To find the sign of f at the test value, substitute it for x in
, and ignore the numerical value, just
look at the sign. f(x) is increasing if f' is positive and
decreasing if f' is negative.
So at critical point where x=-1, f(x) changes from decreasing (going
down to the right) to increasing (going up to the right). So it
must have reached bottom, so there is a relative minimum point that
has x=-1 as its x-coordinate.
At critical point where x=0, f(x) changes from increasing (going
up to the right) to decreasing (going down to the right). So it
must have reached a peak, so there is a relative maximum point that
has x=0 as its x-coordinate.
At the critical point where x=1, f(x) changes from decreasing (going
down to the right) to increasing (going up to the right). So it
must have reached bottom again, so there is another relative minimum
point that has x=1 as its x-coordinate.
Looking at the graph, it goes down to the relative minimum point with
x-coordinate -1, then up to the relative maximum point with x-coordinate
0, then down to the relative minimum point with x-coordinate 1, then up
again thereafter.
Edwin
4x=0; x^2-1=0
x=0; (x-1)(x+1)=0
x-1=0; x+1=0
x=1; x=-1
So the critical points (candidates for the x-coordinates
of relative maximums and minimums).
Now we make this chart:
Interval | x < -1 | -1 < x < 0 | 0 < x < 1 | x > 1
-----------------------------------------------------------------
Test value? | -2 | -0.5 | 0.5 | 2
-----------------------------------------------------------------
Sign of f' | - | + | - | +
at test value? | | | |
-----------------------------------------------------------------
Increasing or |decreasing| increasing | decreasing|increasing
decreasing? |
To find the sign of f at the test value, substitute it for x in
, and ignore the numerical value, just
look at the sign. f(x) is increasing if f' is positive and
decreasing if f' is negative.
So at critical point where x=-1, f(x) changes from decreasing (going
down to the right) to increasing (going up to the right). So it
must have reached bottom, so there is a relative minimum point that
has x=-1 as its x-coordinate.
At critical point where x=0, f(x) changes from increasing (going
up to the right) to decreasing (going down to the right). So it
must have reached a peak, so there is a relative maximum point that
has x=0 as its x-coordinate.
At the critical point where x=1, f(x) changes from decreasing (going
down to the right) to increasing (going up to the right). So it
must have reached bottom again, so there is another relative minimum
point that has x=1 as its x-coordinate.
Looking at the graph, it goes down to the relative minimum point with
x-coordinate -1, then up to the relative maximum point with x-coordinate
0, then down to the relative minimum point with x-coordinate 1, then up
again thereafter.
Edwin

