SOLUTION: We wish to estimate what percent of adult residents in a certain county are parents. Out of 500 adult residents sampled, 325 had kids. Based on this, construct a 95% confidence int
Algebra ->
Probability-and-statistics
-> SOLUTION: We wish to estimate what percent of adult residents in a certain county are parents. Out of 500 adult residents sampled, 325 had kids. Based on this, construct a 95% confidence int
Log On
Question 1202947: We wish to estimate what percent of adult residents in a certain county are parents. Out of 500 adult residents sampled, 325 had kids. Based on this, construct a 95% confidence interval for the proportion p of adult residents who are parents in this county.
Express your answer in tri-inequality form. Give your answers as decimals, to three places.
______< p < _____
Express the same answer using the point estimate and margin of error. Give your answers as decimals, to three places.
p = (.65) |plus or minus| __________ Found 2 solutions by Theo, math_tutor2020:Answer by Theo(13342) (Show Source):
You can put this solution on YOUR website! p = 325 / 500 = .65
q = 1 - p = 1 - .65 = .35
95% two tailed confidence interval requires a critical z-score of plus or minus 1.95966.
z-score formula is z = (x-m)/s
z = z-score
x is the population mean
m is the sample mean
(x-m) is the margin of error.
s is the standard error.
in a proportion type study, s is equal to sqrt(p * q / n) sqrt(.65 * .35 / 500) = .02133.
when the critical z-score is - 1.95996, the formula becomes -1.95996 = (.65 - m) / .02133.
solve for (.65 - m) to get (.65 - m) = -1.95996 * .02133 = -.0418059.
solve for m to get m = .65 + .0418059 = .6918059.
when the critical z-score is 1.95996, the formula becomes 1.95996 = (.65 - m) / .02133.
solve for (.65 - m) to get (.65 - m) = 1.95996 * .02133 = .0418059.
solve for m to get m = .65 - .0418059 = .6081941
your 95% confidence interval is from .6081941 to .6918059
your margin of error is .0418059.
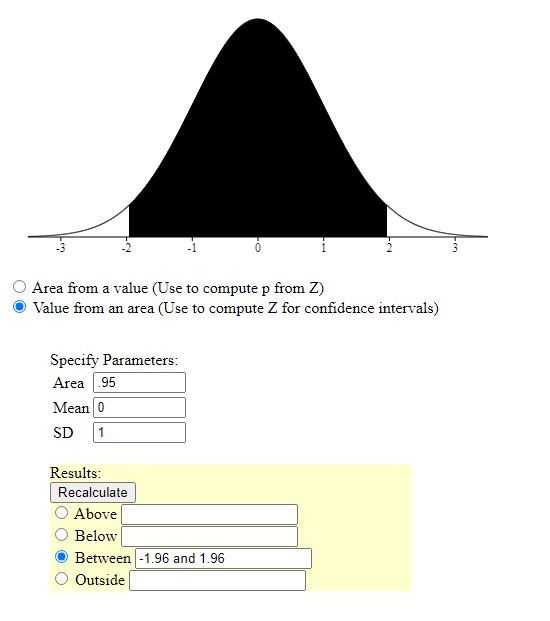
here's what it looks like on a graph.
the first two graphs use z-scores
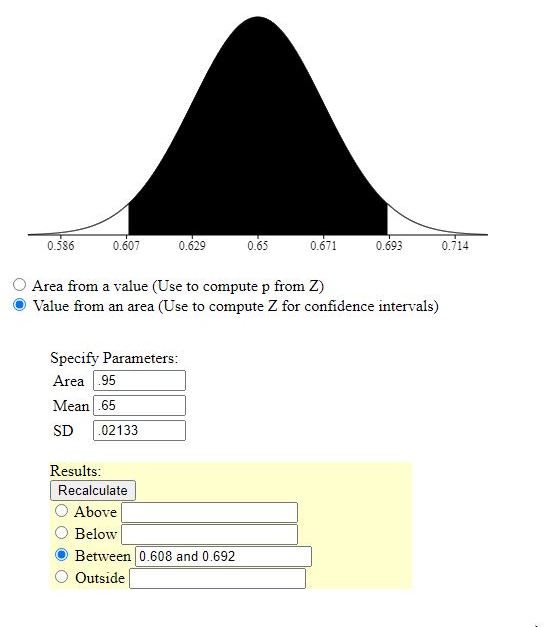
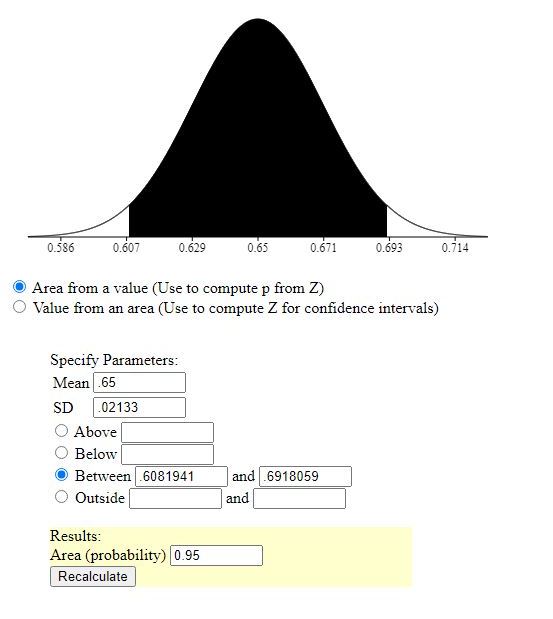
the second two graphs use raw scores
the first graph of each pair is looking for the confidence interval (area) based on the scores.
the second graph of each pair is looking for the scores based on the confidence interval.
when looking for z-scores, the mean is 0 and the standard deviation is 1.
when looking for raw scores, the mean is .65 and the standard deviation is .02133.
what is shown as the standard devition is really the standard error.
E = margin of error
E = z*sqrt(phat*(1-phat)/n)
E = 1.960*sqrt(0.65*(1-0.65)/500)
E = 0.0418082288551
E = 0.042
L = lower boundary
L = phat - E
L = 0.65 - 0.042
L = 0.608
U = upper boundary
U = phat + E
U = 0.65 + 0.042
U = 0.692
The 95% confidence interval for p is roughly 0.608 < p < 0.692
We can optionally condense that to the notation (0.608, 0.692); however, your teacher is opting for the more descriptive notation.
Yet another type of confidence interval notation would be to write p = 0.65 plusMinus 0.042 where the 0.042 refers to the approximate margin of error.


 (
(