Question 309799: The total sales made by a salesperson was $25,000 after 3 months and $68,000 after 23 months. Using an equation for the line whose graph depicts this data, predict the total sales after 40 months.
Answer by checkley77(12844)   (Show Source): (Show Source):
You can put this solution on YOUR website! (3,25) (23,68)
Y=mX+b m=SLOPE &b=THE y INTERCEPT.
SLOPE=(Y2-Y1)/(X2-X1)=(68-25)/(23-3)=43/20 IS THE SLOPE OF THE LINE.
25=43/25*3+b
25=129/25+b
b=25-129/25
b=(25*25-129)/25
b=(625-129)/25
b=496/25
Y=43/25x+496/25 is the line equation for this problem.
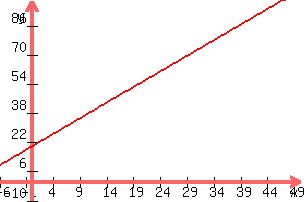 (graph 300x200 pixels, x from -6 to 50, y from -10 to 100, 43x/25 +496/25). (graph 300x200 pixels, x from -6 to 50, y from -10 to 100, 43x/25 +496/25).
In the 40th month the total sales should be:
Y=43/25*40+496/25
Y=1,720/25+19.84
Y=68.8+19.84
Y=88.64 OR $88,640.00
|
|
|