Question 218123: how do you graph y= 6x+6 ?
Found 2 solutions by drj, rkw2375:
Answer by drj(1380)   (Show Source): (Show Source):
You can put this solution on YOUR website! How do you graph y= 6x+6
Step 1. We need two points to plot the line.
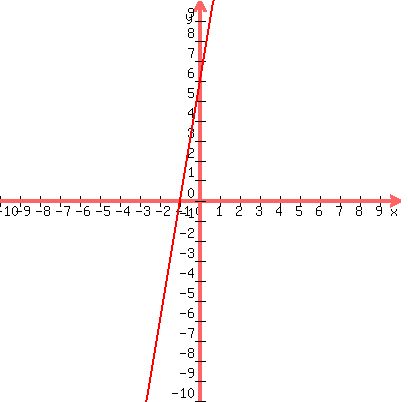
Step 2. Let x=0, then y=6*0+6=6. So we have one point as (0,6).
Step 3. Let y=0, then 0=6x+6 or 6x=-6. Then x=-1 after dividing by 6 to both sides of the equation. Then, the other point is (-1,0).
We can these two points (0,6) and (-1,0) to plot the line:
I hope the above steps and explanation were helpful.
For Step-By-Step videos on Introduction to Algebra, please visit http://www.FreedomUniversity.TV/courses/IntroAlgebra and for Trigonometry please visit http://www.FreedomUniversity.TV/courses/Trigonometry.
Also, good luck in your studies and contact me at john@e-liteworks.com for your future math needs.
Respectfully,
Dr J
http://www.FreedomUniversity.TV
Answer by rkw2375(1)  (Show Source): (Show Source):
You can put this solution on YOUR website! y=mx+b is also referred to as slope-intercept form. b=where the line intercepts the y axis. m = slope, therfore the slope is 6/1 (always think of it as a fraction). the numerator(top number of the fraction is the rise, meaning how many increments to move up from the y intercept, while the bottom number is the run, how many places to move left or right, in this case right since it is a positive number. therefore since B=6, move up the y axis to the sixth increment. the slope is 6/1 so run 1 increment to the right, and up six, then mark that point and draw a line connecting the two points.
|
|
|