Question 821459: The dosage of a certain drug diminishes in the patient's system exponentially. Based on the results in the table, write an equation and sketch a graph of the function that illustrates the diminishing amount of the drug that remains over time.
Table:
Time (hrs) Amount (mgs)
1 160
3 40
Answer by KMST(5347)   (Show Source): (Show Source):
You can put this solution on YOUR website! Obviously, if the amount was reduced by a factor  in in  hours, hours,
 with with  or or 
You could talk about the irrational number  , and even about calculus and derivatives. , and even about calculus and derivatives.
You could write it as
 . .
but it is not rocket science.
If it started at time zero as a certain amount  , ,
and is reduced by a factor  each hour that passes, each hour that passes,
to  at one hour, at one hour,
to  at 2 hours, and at 2 hours, and
to  at 3 hours, at 3 hours,
then  and and  . .
The half life of the drug is 1 hour.
Each hour that passes the amount is multiplied times one half (divided by 2).
At 2 hour, the level is 80 mg,
at 4 hours the level is 40 mg,
at 4 hours the level is 10 mg,
at 5 hours the level is 5 mg,
and so on.
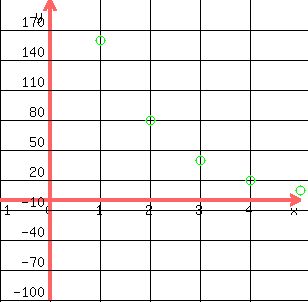
The original data plus the additional values above would allow you to graph Amount in mg, on the y-axis,
against t=time in hours, on the x-axis.
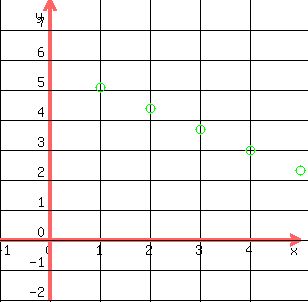
You may want to graph  , on the y-axis, , on the y-axis,
against t=time in hours,
to get a straight line.
No knowledge pharmacokinetics, calculus, precalculus, or advanced algebra is needed.
No memorized procedures and formulas are needed (except to please the teacher/instructor).
(Understanding basic algebra, and being able and confident enough to think for yourself is as good or better than those memorized procedures and formulas).
If pharmacokinetics were your course, you would have to understand that the amount in the body cannot be measured directly, and may be hard or impossible to estimate. You just measure drug levels in blood (or plasma), and in various tissues.
|
|
|