Tutors Answer Your Questions about Density-curves-and-normal-distributions (FREE)
Question 1180015: Suppose 200 people are lined up side-by-side, each one holding a fair coin. Each person flips their coin 64 times; every time it lands heads they step 1 meter forward, each time it lands tails they step 1 meter backward. Use a normal approximation to answer the following question: after everyone finishes their 64 steps, approximately how many people will be standing between 4 and 8 meters behind the starting line?
Found 2 solutions by ikleyn, CPhill:
Answer by ikleyn(53763)   (Show Source): (Show Source):
You can put this solution on YOUR website! .
I agree with the solution by @CPhill almost everywhere, except of its final part.
After the number of interest of heads is determined to be between 28 and 30 inclusive,
the continuity correction should be applied.
Thus, actually, we look for the probability for H to be between 27.5 and 30.5.
So, in the solution by @CPhill the z-scores z1 and z2 should be modified consistently.
The final answer for the probability is then 0.2235 instead of 0.1498,
and the number of people between -8 and -4 meters is then about 0.2235*200 = 44.7,
or about 45.
This difference is significant and, therefore, should be accounted.
Answer by CPhill(2189)  (Show Source): (Show Source):
You can put this solution on YOUR website! Here's how to solve this problem using a normal approximation:
**1. Define the Random Variable:**
* Let X be the number of heads in 64 coin flips.
* X follows a binomial distribution with n = 64 and p = 0.5.
* Each person's final position is determined by the difference between the number of heads and tails.
**2. Relate Position to Heads and Tails:**
* Let H be the number of heads and T be the number of tails.
* Final position = H - T
* We know H + T = 64, so T = 64 - H
* Final position = H - (64 - H) = 2H - 64
**3. Determine the Range of Heads:**
* We want to find the number of people between -8 and -4 meters.
* -8 ≤ 2H - 64 ≤ -4
* 56 ≤ 2H ≤ 60
* 28 ≤ H ≤ 30
**4. Approximate with a Normal Distribution:**
* The binomial distribution can be approximated by a normal distribution when n is large enough.
* Mean (μ) = np = 64 * 0.5 = 32
* Standard deviation (σ) = √(np(1-p)) = √(64 * 0.5 * 0.5) = √16 = 4
**5. Calculate Z-scores:**
* For H = 28: z1 = (28 - 32) / 4 = -1
* For H = 30: z2 = (30 - 32) / 4 = -0.5
**6. Find the Probability:**
* Use a standard normal distribution table or calculator to find the area between z1 and z2.
* P(-1 ≤ Z ≤ -0.5) = P(Z ≤ -0.5) - P(Z ≤ -1)
* P(Z ≤ -0.5) ≈ 0.3085
* P(Z ≤ -1) ≈ 0.1587
* P(-1 ≤ Z ≤ -0.5) ≈ 0.3085 - 0.1587 = 0.1498
**7. Calculate the Number of People:**
* Multiply the probability by the total number of people: 200 * 0.1498 ≈ 29.96
**Answer:**
Approximately 30 people will be standing between 4 and 8 meters behind the starting line.
Question 1186329: A random variable is normally distributed. It has a mean of 245 and a standard deviation of 21.
a.) If you take a sample of size 10, can you say what the shape of the distribution for the sample mean is? Why?
b.) For a sample of size 10, state the mean of the sample mean and the standard deviation of the sample mean.
c.) For a sample of size 10, find the probability that the sample mean is more than 241.
d.) If you take a sample of size 35, can you say what the shape of the distribution of the sample mean is? Why?
e.) For a sample of size 35, state the mean of the sample mean and the standard deviation of the sample mean.
f.) For a sample of size 35, find the probability that the sample mean is more than 241.
g.) Compare your answers in part c and f. Why is one smaller than the other?
Answer by CPhill(2189) (Show Source):
You can put this solution on YOUR website! Here's the solution:
**a.) Shape of the distribution for the sample mean (n=10):**
Yes. Because the original population is normally distributed, the sampling distribution of the sample mean will *also* be normally distributed, regardless of the sample size.
**b.) Mean and standard deviation of the sample mean (n=10):**
* Mean of the sample mean (μₓ̄) = Population mean (μ) = 245
* Standard deviation of the sample mean (σₓ̄) = Population standard deviation (σ) / √n = 21 / √10 ≈ 6.64
**c.) Probability that the sample mean is more than 241 (n=10):**
1. **Calculate the z-score:**
z = (x̄ - μ) / σₓ̄
z = (241 - 245) / 6.64
z ≈ -0.60
2. **Find the probability:**
Using a z-table or calculator, find the probability of z being *greater* than -0.60.
P(z > -0.60) ≈ 0.7257
**d.) Shape of the distribution of the sample mean (n=35):**
Yes. Again, since the original population is normally distributed, the sampling distribution of the sample mean will *also* be normally distributed, even with a larger sample size.
**e.) Mean and standard deviation of the sample mean (n=35):**
* Mean of the sample mean (μₓ̄) = Population mean (μ) = 245
* Standard deviation of the sample mean (σₓ̄) = Population standard deviation (σ) / √n = 21 / √35 ≈ 3.56
**f.) Probability that the sample mean is more than 241 (n=35):**
1. **Calculate the z-score:**
z = (x̄ - μ) / σₓ̄
z = (241 - 245) / 3.56
z ≈ -1.12
2. **Find the probability:**
Using a z-table or calculator, find the probability of z being *greater* than -1.12.
P(z > -1.12) ≈ 0.8686
**g.) Comparison of probabilities and explanation:**
The probability in part f (n=35) is larger than the probability in part c (n=10). This is because the standard deviation of the sample mean is *smaller* for the larger sample size. A smaller standard deviation means the sample means are more tightly clustered around the population mean. Therefore, it's more likely that a sample mean from a larger sample will be closer to the population mean (and thus more likely to be above 241 in this case). In simpler terms, larger samples provide more precise estimates.
Question 1186331: The mean cholesterol levels of women age 45-59 in Ghana, Nigeria, and Seychelles is 5.1 mmol/l and the standard deviation is 1.0 mmol/l (Lawes, Hoorn, Law & Rodgers, 2004). Assume that cholesterol levels are normally distributed.
a.) State the random variable.
b.) Find the probability that a woman age 45-59 in Ghana has a cholesterol level above 6.2 mmol/l (considered a high level).
c.) Suppose doctors decide to test the woman’s cholesterol level again and average the two values. Find the probability that this woman’s mean cholesterol level for the two tests is above 6.2 mmol/l.
d.) Suppose doctors being very conservative decide to test the woman’s cholesterol level a third time and average the three values. Find the probability that this woman’s mean cholesterol level for the three tests is above 6.2 mmol/l.
e.) If the sample mean cholesterol level for this woman after three tests is above 6.2 mmol/l, what could you conclude?
Answer by CPhill(2189) (Show Source):
You can put this solution on YOUR website! Here's how to solve this problem:
**a.) State the random variable.**
The random variable is the cholesterol level (in mmol/l) of a woman aged 45-59 in Ghana.
**b.) Probability of cholesterol level above 6.2 mmol/l (one test):**
1. **Calculate the z-score:**
z = (x - μ) / σ
z = (6.2 - 5.1) / 1.0
z = 1.1
2. **Find the probability:**
Using a z-table or calculator, find the probability of a z-score being *greater* than 1.1. This represents the area to the *right* of 1.1 on the standard normal distribution.
P(z > 1.1) ≈ 0.1357
Therefore, the probability that a woman's cholesterol level is above 6.2 mmol/l is approximately **0.1357**.
**c.) Probability of mean cholesterol level above 6.2 mmol/l (two tests):**
When averaging two tests, we are dealing with the *sampling distribution of the mean*. The standard deviation of this distribution (also called the standard error) is:
Standard Error = σ / √n = 1.0 / √2 ≈ 0.7071
1. **Calculate the z-score:**
z = (x̄ - μ) / (σ / √n)
z = (6.2 - 5.1) / 0.7071
z ≈ 1.56
2. **Find the probability:**
P(z > 1.56) ≈ 0.0594
Therefore, the probability of the mean cholesterol level for two tests being above 6.2 mmol/l is approximately **0.0594**.
**d.) Probability of mean cholesterol level above 6.2 mmol/l (three tests):**
The standard error for three tests is:
Standard Error = σ / √n = 1.0 / √3 ≈ 0.5774
1. **Calculate the z-score:**
z = (x̄ - μ) / (σ / √n)
z = (6.2 - 5.1) / 0.5774
z ≈ 1.90
2. **Find the probability:**
P(z > 1.90) ≈ 0.0287
Therefore, the probability of the mean cholesterol level for three tests being above 6.2 mmol/l is approximately **0.0287**.
**e.) Conclusion if the sample mean after three tests is above 6.2 mmol/l:**
If the sample mean cholesterol level after three tests is above 6.2 mmol/l, we have stronger evidence to suggest that the woman's *true* mean cholesterol level may be higher than 5.1 mmol/l. While there is still a small probability (about 2.87%) of observing this result if the true mean is actually 5.1, the repeated measurements make it less likely that it is due to random chance.
It's important to remember that this is still a probability. We can't definitively say her mean is higher, but the evidence suggests it is more probable than before the repeated tests. Further testing or investigation might be warranted.
Question 1194450: Yuen Zhi is running a ring toss event at the school fair. In the event, each attempt has a 15% chance of winning a prize. She has 45 prizes and believes that 250 people will attempt the event. She is worried that she won't have enough prizes. Based on the information provided, can Yuen be at least 95% confident that she will she have enough prizes for the event?
Answer by yurtman(42) (Show Source): (Show Source):
You can put this solution on YOUR website! **1. Define the Variables:**
* **n:** Number of attempts = 250
* **p:** Probability of winning a prize = 0.15
* **X:** Number of prizes won
**2. Calculate the Expected Number of Prizes Won:**
* Expected number of prizes = n * p = 250 * 0.15 = 37.5
**3. Determine the Standard Deviation:**
* Standard deviation (σ) = √(n * p * (1 - p)) = √(250 * 0.15 * 0.85) ≈ 5.63
**4. Use Normal Approximation (Assuming n*p and n*(1-p) are both greater than 5):**
* Since n*p = 37.5 and n*(1-p) = 212.5, both are greater than 5, we can use the normal approximation to the binomial distribution.
* **Calculate the Z-score for 95% Confidence:**
* For a 95% confidence level, the Z-score is approximately 1.96 (from the standard normal distribution table).
* **Calculate the Upper Bound for the Number of Prizes:**
* Upper Bound = Expected Value + (Z-score * Standard Deviation)
= 37.5 + (1.96 * 5.63) ≈ 48.6
**5. Conclusion:**
* Based on the normal approximation, Yuen can be at least 95% confident that the number of prizes won will be less than or equal to 48.6.
* Since she has 45 prizes, there is a possibility that she might not have enough prizes for all the winners at the 95% confidence level.
**Important Note:**
* This analysis uses a normal approximation, which may have some slight inaccuracies. For more precise calculations, you could use the binomial distribution directly (using statistical software or tables).
Let me know if you'd like a more detailed explanation of any of the steps or if you have any other questions.
Question 1194474: We have been using the normal distribution to approximate situations that are, in fact, binomial events. Create an example of a binomial event that can be approximated by a normal distribution and:
a)Demonstrate how accurate the approximation is by using both approaches to find the probability of the same event. Hint: Calculate the probability of the event as a binomial (sum of all binomial events) and calculate the probability of the approximated event using a normal distribution, and compare them to see how close the approximation is.
b)Describe the conditions under which the normal distribution would give a less accurate approximation.
c)Explain a situation in which the criteria for using the normal approximation would be met, i.e.np≥5 and n(1-p)≥5, and yet you would decide not to use the normal distribution.
Answer by yurtman(42) (Show Source):
You can put this solution on YOUR website! ### Example of a Binomial Event Approximated by a Normal Distribution
**Scenario**: A factory produces light bulbs, and the probability of a bulb being defective is \( p = 0.02 \). The factory produces \( n = 500 \) bulbs in a day. Let \( X \) represent the number of defective bulbs in a batch of 500.
We want to find the probability that exactly 15 bulbs are defective (\( P(X = 15) \)).
---
### Part A: Calculating the Probability Using Both Approaches
#### 1. Binomial Approach
The probability mass function for a binomial distribution is given by:
\[
P(X = k) = \binom{n}{k} p^k (1-p)^{n-k}
\]
For \( n = 500 \), \( p = 0.02 \), and \( k = 15 \), the exact probability is:
\[
P(X = 15) = \binom{500}{15} (0.02)^{15} (0.98)^{485}
\]
We'll calculate this value explicitly.
#### 2. Normal Approximation
The binomial distribution can be approximated by a normal distribution if \( np \geq 5 \) and \( n(1-p) \geq 5 \). Here:
\[
np = 500 \times 0.02 = 10, \quad n(1-p) = 500 \times 0.98 = 490
\]
Both conditions are satisfied.
The approximating normal distribution has mean and standard deviation:
\[
\mu = np = 10, \quad \sigma = \sqrt{np(1-p)} = \sqrt{500 \times 0.02 \times 0.98} \approx 3.13
\]
To approximate \( P(X = 15) \), we use the continuity correction, finding \( P(14.5 \leq X \leq 15.5) \):
\[
Z_1 = \frac{14.5 - 10}{3.13}, \quad Z_2 = \frac{15.5 - 10}{3.13}
\]
The corresponding probabilities are found using the standard normal table or software.
---
### Part B: Conditions for Less Accurate Approximation
The normal approximation becomes less accurate when:
1. \( p \) is close to 0 or 1, making the distribution highly skewed.
2. \( n \) is small, violating the \( np \geq 5 \) and \( n(1-p) \geq 5 \) conditions.
3. The event involves a discrete probability at the tails of the distribution where the binomial and normal curves differ significantly.
---
### Part C: When Not to Use the Normal Approximation Despite Meeting the Criteria
Even if \( np \geq 5 \) and \( n(1-p) \geq 5 \), the normal approximation may not be ideal when:
1. **Precision is critical**: The binomial distribution provides exact probabilities, whereas the normal approximation involves rounding and continuity corrections.
2. **Events near the tails**: For probabilities of rare events (e.g., \( P(X = n) \) when \( n \) is far from the mean), the normal approximation may misestimate the probabilities.
3. **Computational ease**: With modern software, binomial probabilities are easy to compute, making the exact approach preferable.
For example, if \( n = 20 \) and \( p = 0.25 \), both criteria are satisfied, but the distribution is still not symmetric, making the normal approximation less accurate. Using the exact binomial distribution would yield better results.
Question 1204994: In a factory that produces wire, the spooling machine is programmed to 3,500 feet of wire on each spool. The company ran the machine and then measured how much wire was actually on each spool. They found that the mean length was actually 3,510 feet and the standard deviation was 25 feet. They then ran the machine again and produced a sample of 400 spools of wire. Assume that the data is normally distributed.
1. Draw a normal distribution curve; be sure to include all the intervals and percentages.
2. What is the median and mode?
3. How many spools have at least 3,510 feet of wire?
4. How many spools have less than 3,485 feet of wire?
5. How many spools have between 3,485 and 3,560 feet of wire?
6. How many spools have between 3,460 and 3,535 feet of wire?
7. How many spools are within one standard deviation?
8. How many spools have less than 3,560 feet of wire?
9. How many spools make this inequality true: the amount of wire > 3,485 feet?
Answer by ikleyn(53763) (Show Source):
You can put this solution on YOUR website! .
Duplicate.
Just solved under this link
https://www.algebra.com/statistics/Density-curves-and-normal-distributions/Density-curves-and-normal-distributions.faq.question.1204995.html
Question 1204995: In a factory that produces wire, the spooling machine is programmed to 3,500 feet of wire on each spool. The company ran the machine and then measured how much wire was actually on each spool. They found that the mean length was actually 3,510 feet and the standard deviation was 25 feet. They then ran the machine again and produced a sample of 400 spools of wire. Assume that the data is normally distributed.
1. Draw a normal distribution curve; be sure to include all the intervals and percentages.
2. What is the median and mode?
3. How many spools have at least 3,510 feet of wire?
4. How many spools have less than 3,485 feet of wire?
5. How many spools have between 3,485 and 3,560 feet of wire?
6. How many spools have between 3,460 and 3,535 feet of wire?
7. How many spools are within one standard deviation?
8. How many spools have less than 3,560 feet of wire?
9. How many spools make this inequality true: the amount of wire > 3,485 feet?
Answer by Theo(13342)  (Show Source): (Show Source):
You can put this solution on YOUR website! the mean of the population is 3510 and the population standard deviation is 25.
you run 400 spools through the machine.
1. Draw a normal distribution curve; be sure to include all the intervals and percentages.
each particular situation is drawn below.
2. What is the median and mode?
if it is a normal distribution, then the mean and the mode and the median are the same value at an average of 3510 per spool.
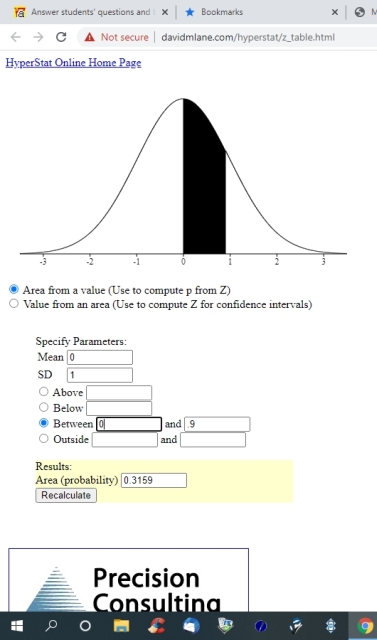
3. How many spools have at least 3,510 feet of wire?
to find the number, the proportions are multiplied by 400 to get an estimate of the approximate number of spools that satisfy the criteria.
since the mean is 3510, than half should have a mean less than 3510 and half should have a mean greater than 3510.

.5 * 400 = 200.
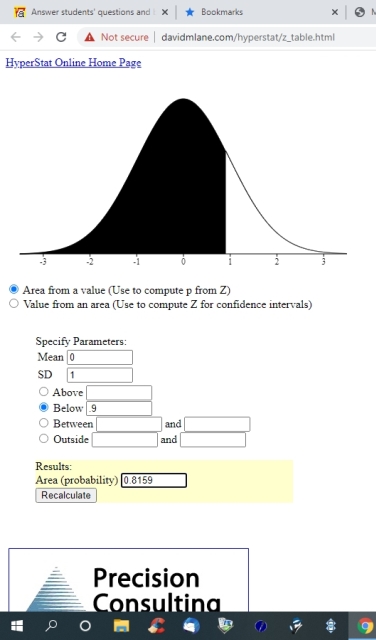
4. How many spools have less than 3,485 feet of wire?

.1587 * 400 = 63.48 = 63 rounded to the nearest integer.
5. How many spools have between 3,485 and 3,560 feet of wire?

.8186 * 400 = 327.44 = 327 rounded to the nearest integer.
6. How many spools have between 3,460 and 3,535 feet of wire?

.8186 * 400 = 327.44 = 327 rounded to the nearest integer.
7. How many spools are within one standard deviation?
1 standard deviation is 25.
to be within 1 standard deviation, then 3510 - 25 = 3485 on the low end, and 3510 + 25 = 3535 on the high end.

.6827 * 400 = 273.08 = 273 rounded to the nearest integer.
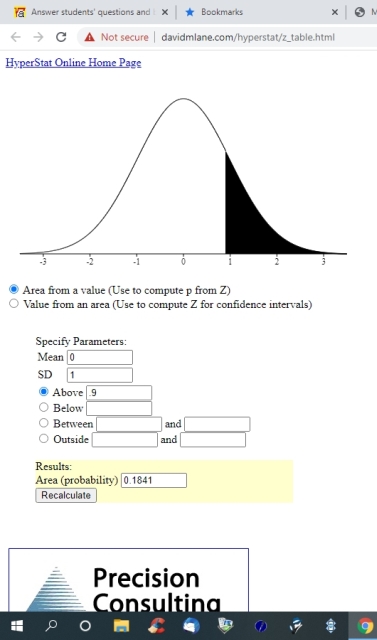
8. How many spools have less than 3,560 feet of wire?

.9772 * 400 = 390.88 = 391 rounded to the nearest integer.
9. How many spools make this inequality true: the amount of wire > 3,485 feet?

.8413 * 400 = 336.52 = 337 rounded to the nearest integer.
calculator used is at https://davidmlane.com/hyperstat/z_table.html
Question 1202427: The average credit card debit for public school teacher is 14, 975. If the devt is normally distributed with a standard deviation of 650, find the probabilities (a) that the teacher owes at least 8, 740 (b) that the teacher owes more than 19, 270 (c) and that teacher owes between 6,740 and 19, 270
Answer by ikleyn(53763) (Show Source):
You can put this solution on YOUR website! .
A TWIN problem was solved under this link
https://www.algebra.com/algebra/homework/Probability-and-statistics/Probability-and-statistics.faq.question.1202308.html
with detailed description of the method.
If you apply the same method to the current problem, you will get the following answers
(a) p = 1.00
(b) p = 0.00
(c) p = 1.00
with at least two correct decimals after the decimal dot.
Question 1199833: A factory produces 5,000 tablet computers in 4 days, how many tablet computers would be produced in 5 days?
Found 2 solutions by ikleyn, josgarithmetic:
Answer by ikleyn(53763) (Show Source):
Answer by josgarithmetic(39799) (Show Source):
Question 1194451: We have been using the normal distribution to approximate situations that are, in fact, binomial events. Create an example of a binomial event that can be approximated by a normal distribution and:
a)Demonstrate how accurate the approximation is by using both approaches to find the probability of the same event. Hint: Calculate the probability of the event as a binomial (sum of all binomial events) and calculate the probability of the approximated event using a normal distribution, and compare them to see how close the approximation is.
b)Describe the conditions under which the normal distribution would give a less accurate approximation.
Explain a situation in which the criteria for using the normal approximation would be met, i.e. np≥5 and n(1-p)≥5 , and yet you would decide not to use the normal distribution.
Answer by Boreal(15235)  (Show Source): (Show Source):
You can put this solution on YOUR website! b and c first. Use a normal approximation for a skewed distribution binomial with small n and p=0.9, and it will have more error.
If a binomial is completely symmetrical, it may be approximated by a normal distribution quite well with small np or n(1-p).
-
A baseball player is batting 0.400. What is the probability he will get no more than 10 hits in the next 50 at bats? The exact is 0.00076 or 0.0008 probability
look at 50C9*0.40^9*0.60^41=0.000527
for 8 hits 0.000169, and this for the others will converge to the exact.
-
np=20 hits mean
np(1-p)=20*0.6=12 hits variance; SD is sqrt(V)=3.464 hits
probability of z < 9.5 is z(9.5-20)/3.464=-3.03
The probability of z < -3.03 is 0.0012, a decent approximation.
Question 1194452: In many situations, the normal distribution can be used to approximate the binomial distribution.
a)Explain the conditions in which this can be done, and explain why we might take advantage of this property.
Answer by Boreal(15235) (Show Source):
You can put this solution on YOUR website! If there are two outcomes with constant probability
if np and n(1-p) are > 5 (some use 10)
Do this where large factorials might occur and cannot be calculated.
A batter is hitting 0.400. In the next 200 at bats, what is the chance of his getting 90 or more hits.
With the binomial, this is 200C50 *0.4^90*0.6^110, and that is only for 90 hits. One has to calculate 91, 92,
Normal approximation np=80 (mean)
np(1-p)=80*0.6=48 (variance)
sqrt 48 is 6.93
want z>(89.5-80)/6.83, and that is a lot easier to do.
Question 1192857: In a normal distribution with mean 56 and standard deviation 21, how large a sample must be taken so that there will be at least a 90% percent chance that its mean is greater than
52? Recall that Z= x-mu/sigma/sqrt(n)
Can a tutor please assist me, what should I do to find n?
Answer by math_tutor2020(3835) (Show Source):
You can put this solution on YOUR website!
mu = population mean = 56
sigma = population standard deviation = 21
We're wanting to find the value of n that will make
P(xbar > 52) = 0.90
to be possible.
This is equivalent to finding a value of k such that
P(Z > k) = 0.90
and that in turn is the same as
P(Z < k) = 0.10
I'll use this Z table
https://www.ztable.net/
to find that P(Z < -1.28) = 0.10027 which is the closest we can get to 0.10
So P(Z < -1.28) = 0.10 approximately
and
P(Z > -1.28) = 0.90 approximately
The key takeaway is that z = -1.28 is the approximate z score.
That z score is then used to solve for n like so
Z = (x-mu)/(sigma/sqrt(n))
-1.28 = (52-56)/(21/sqrt(n))
-1.28*(21/sqrt(n)) = -4
-26.88 = -4sqrt(n)
sqrt(n) = -26.88/(-4)
sqrt(n) = 6.72
n = (6.72)^2
n = 45.1584
n = 45
Answer: 45
Question 1192832: Kingston Electronics, inc., offers a “no hassle” returns policy. The number of items returned per day follows the normal distribution. The mean number of customer returns is 10.3 per day and the standard deviation is 2.25 per day.
1)The probability that the number of returns exceed a particular amount of 5%. What is the number of returns?
I did the following:
n= (z*std/Error)^2
(1.645* 2.25/.05)^2
Please assist me.
Answer by math_tutor2020(3835) (Show Source):
You can put this solution on YOUR website!
This problem is not asking for the min sample size.
Instead, your teacher wants to know the value of k such that P(Z > k) = 0.05
The value of k itself is not the answer but it will lead to it.
The Z refers to the standard normal distribution variable. It's a very special normal bell curve with mean = 0 and standard deviation = 1.
Use a table such as this
https://www.ztable.net/
or similar found in your textbook to find that P(Z < -1.65) = 0.04947 which is close enough to 0.05
Due to symmetry, P(Z > 1.65) = 0.04947 = 0.05
Use this as the z score to find the corresponding raw score x.
z = (x-mu)/sigma
z*sigma = x-mu
x = mu+z*sigma
x = 10.3 + 1.65*2.25
x = 14.0125
This rounds to x = 14
So P(X > 14) = 0.05 approximately when X follows a normal distribution with mu = 10.3 and sigma = 2.25, which is the mean and standard deviation respectively.
The number of returns in the set {14, 15, 16, ...} constitutes the top 5% of all returns.
Answer: 14
Side note: you can use a calculator such as this one
https://davidmlane.com/normal.html
to make the process much quicker, but I have a feeling your teacher will want you to use a Z table and/or show some semblance of the steps done.
Of course, it's best to ask your teacher which methods are allowed.
The calculator is at least a good way to check your work as shown in the screenshot below.

Question 1192018: The scores in a Statistics test follow a normal distribution with an average score of 82 and standard deviation of 5. If all students who got 88 to 94 received a "very good", and it was announced that only 8 received a very good, how many students took the test?
Answer by Theo(13342) (Show Source):
You can put this solution on YOUR website! mean is 82.
standard deviation is 5.
all students who got 88 to 94 received very good.
only 8 received very good.
x-score formula is z = (x-m)/sd
z is the z-score
x is the raw score
m is the mean
sd is the standard deviation
low z-score = (88 - 82) / 5 = 1.2
high z-score = (94 - 82) / 5 = 2.4
area between these z-scores is equal to .10687.
take 8 and divide it by that to get 74.85.
that should be your answer.
round to 75 if you need integers.
with population of 75, .10687 * that = = 8.01 which you can round to 8.
you will not get an integer answer so some rounding will be required.
Question 1186734: The patient recovery time from a particular surgical procedure is normally distributed with a mean of 5.7 days and standard deviation of 1.8 days. Use your graphing calculator to answer the following questions. Write your answers in percent form. Round your answers to the nearest tenth of a percent.
a) What is the probability of spending less than 9 days in recovery? %
b) What is the probability of spending more than 4 days in recovery? %
c) What is the probability of spending between 4 days and 9 days in recovery? %
Answer by ikleyn(53763) (Show Source):
You can put this solution on YOUR website! .
On solving such problems using GRAPHING CALCULATOR see THIS Internet source / site
https://mathbits.com/MathBits/TISection/Statistics2/normaldistribution.htm
Find there EVERYTHING you need to know in clear and compact form
to solve this problem (and thousands other similar and different problems) ON YOUR OWN.
I am open to accept your deepest " THANKS " to me for my teaching and for this UNVALUABLE instruction/information
Question 1186330: According to the WHO MONICA Project the mean blood pressure for people in China is 128 mmHg with a standard deviation of 23 mmHg (Kuulasmaa, Hense & Tolonen, 1998). Blood pressure is normally distributed.
a.) State the random variable.
b.) Suppose a sample of size 15 is taken. State the shape of the distribution of the sample mean.
c.) Suppose a sample of size 15 is taken. State the mean of the sample mean.
d.) Suppose a sample of size 15 is taken. State the standard deviation of the sample mean.
e.) Suppose a sample of size 15 is taken. Find the probability that the sample mean blood pressure is more than 135 mmHg.
f.) Would it be unusual to find a sample mean of 15 people in China of more than 135 mmHg? Why or why not?
g.) If you did find a sample mean for 15 people in China to be more than 135 mmHg, what might you conclude?
Answer by Boreal(15235) (Show Source):
You can put this solution on YOUR website! random variable is the blood pressure.
n=15 from a normal distribution is normally distributed itself with sample mean (for n=15) 128, same as pop. mean and sd of 23/sqrt(15) mm
-
z=(xbar-mean)/sigma/sqrt(n)
=(135-128)*sqrt(135)/23
=1.18
probability of that z or greater is 0.1190
It would not be common but not unusual to find that value.
If I found a value >135, what I would think of it would depend upon what my cutoff value for abnormal were, before I did the study. Since most cutoff values are <0.10, I would likely not consider the value abnormal.
Question 1186173: Think of something in your work or personal life that you measure regularly (No actual calculation of the mean, standard deviation or z scores is necessary). What value is “average”? What values would you consider to be unusually high or unusually low? If a value were unusually high or low—how would it change your response to the measurement?
Answer by ikleyn(53763) (Show Source):
Question 1186175: 1.) The commuter trains on the Red Line for the Regional Transit Authority (RTA) in Cleveland, OH,
have a waiting time during peak rush hour periods of eight minutes ("2012 annual report," 2012).
a.) State the random variable.
b.) Find the height of this uniform distribution.
c.) Find the probability of waiting between four and five minutes.
d.) Find the probability of waiting between three and eight minutes.
e.) Find the probability of waiting five minutes exactly.
Found 2 solutions by greenestamps, ikleyn:
Answer by greenestamps(13334)  (Show Source): (Show Source):
You can put this solution on YOUR website!
Using the logic stated in the response from tutor @ikleyn....
c.)
        5-4    1
   P = ----- = -
         8     8

d.)
        8-5    3
   P = ----- = -
         8     8

 e.)
        5-5    0
   P = ----- = - = 0
         8     8
The probability of waiting ANY EXACT amount of time is zero.
The method used in tutor @ikleyn's response is exactly the way to answer these questions. The probability of waiting between A and B minutes is the difference between those two times, divided by the length of the whole interval.
So, as I showed in my response, her answers for parts c and d are correct.
But in her response for part e, she does not use that calculation. In part e, the beginning and ending times of the prescribed interval are the same, so the difference in the two times is 0, so the probability of waiting exactly 5 minutes (or any other exact amount of time) is 0.
In her response, she states (with no justification and no calculations) that the probability of waiting exactly 5 minutes is 5/8. Note that is the same probability as for part d; that means the probability of waiting between 3 and 8 minutes is the same as the probability of waiting exactly 5 minutes -- which means the probability of waiting anywhere between 3 and 5 minutes or between 5 and 8 minutes is zero.
Totally absurd...!
I here post in its entirety, with my editing, the arrogant addendum tutor @ikleyn posted on her response after seeing my response. Now she won't be able to erase it from her response; that way the whole world will be able to see what kind of a person she is.
Regarding the post by @greenestamps, I am PERPLEXED.
My note: Yes, you certainly are....
From one side, following my post and my logic, @greenestamps correctly re-wrote parts (c) and (d) from my post.
Thank you, @greenestamps, for popularizing my solution.
I simply showed that her method for getting the answers was right; with her defensive nature, she chose to mock me for repeating what was in her response.
From the other side, in part (e) he writes p =  = =  = 0, = 0,
saying that the probability of waiting ANY EXACT amount of time is zero.
First, notice that my post in part (e) states something very different from it:
namely, it states that P =  in this case, and it is CORRECT. in this case, and it is CORRECT.
I did not attribute to you the statement that the probability of waiting exactly 5 minutes is 0. My response instead showed that the CORRECT answer for part e is 0.
Absolutely my response states something different than yours, because your response is WRONG!
So, if @greenestamps wants to disprove me, then he is wrong TWICE:
1) he attributes me the statement, which I did not make,
I did not attribute anything to you; I used your correct method for getting the answer to show that your answer is incorrect.
and
2) on the way he is wrong CONCEPTUALLY, saying that the probability of waiting any exact amount of time is zero.
Sorry, arrogant lady; that statement is correct.
Reagrding part 1), everything is clear;
regarding part 2), it is the same as to say that it is not possible in classic mechanic to measure exactly 5 minutes.
Not at all a good argument.
It's more like saying that the probability of taking the interval from 0 to 8 on a number line and asking for the probability of picking the point 5. The interval has length 8; the point has 0 width; the probability is 0.
If you, @greenestamp, will tell it to any physicist, he, probably, will not argue with you;
simply will twist a finger to the temple.
Regarding attributing me statements, which I did not make, this trick of making dispute is as old as the world,
and it is called DEMAGOGY.
Proclaiming that your wrong answer is correct is what demagogy is....
It is not the first time, when @greenestamps uses this way to argue in his discussions with me.
He just did it more than once in the past.
In the scientific and engineering communities, such tricks making dispute traditionally cause disgust.
In ANY community, your arrogance and your way of denigrating others causes disgust
\\\\\\\\\\\\\\\\
The bottom line for you, the reader, is that all my statements in my post are correct.
Not so....
Statements (c) and (d) in the @greenestamps' post, repeating my (c) and (d), are correct, too.
Yes, that's what I said in my post....
Statement (e) in the @greenestapmp's post is wrong.
No, ma'am. YOUR answer for part e is wrong.
Answer by ikleyn(53763) (Show Source):
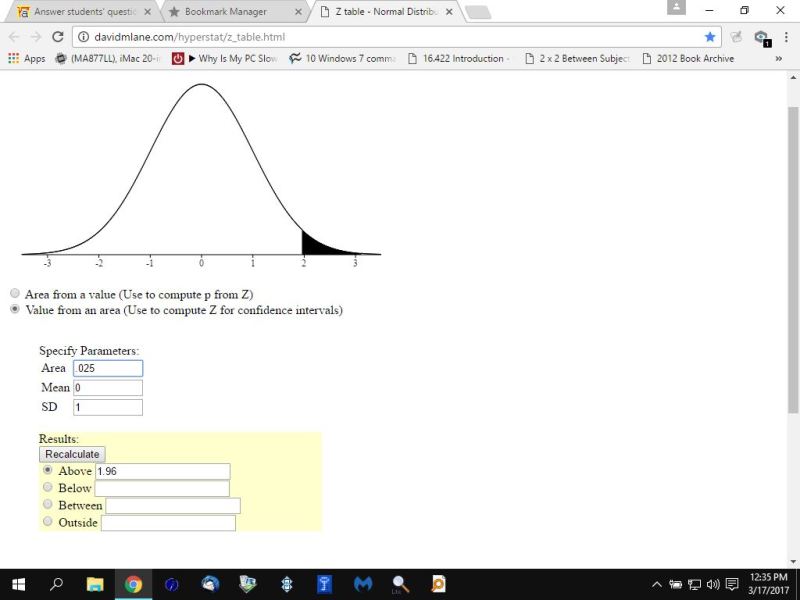
Question 1184185: Suppose that the mean retail price per gallon of regular grade gasoline in the United States is $3.45 with a standard deviation of $.20 and that the retail price per gallon has a bell shaped distribution. What percentage of a regular grade gasoline sold for more than $3.85 per gallon
Answer by Theo(13342) (Show Source):
You can put this solution on YOUR website! population mean = 3.45
population standard deviation = .20
z = (x - m) / s
z is the z-score
x is the raw score
m is the raw mean
s is the standard deviation.
formula becomes:
z = (3.85 - 3.45) / .2 = 2.
area to the right of a z-score of 2 is equal to .022750062.
that's the probability of the price of gasoline being greater than 3.85.
the probability of .022750062 rounds to .0228 as shown in the following diaplay of the z-score calculator by david m. lane.

the z-score calculator can work off the mean and standard deviation to give you the raw score, as shown.
the z-score calculator gives you the z-score if the mean is set to 0 and the standard deviation is set to 1.
here's the display when looking for the z-score.

Question 1184184: What percentage of a regular grade gasoline sold for more than $3.85 per gallon
Answer by josgarithmetic(39799) (Show Source):
Question 1184061: if a cube has a volume of "147" cm 3, what are the lengths of the sides of this cube in inches?
Answer by MathLover1(20855)  (Show Source): (Show Source):
Question 1183503: . Public health records indicate that t weeks after the outbreak of a certain strain of influenza, approximately
Q(t) = 20
1 + 19 e−1.2t
thousand people had caught the disease.
(a) How many people had the disease when it broke out? How many had it 2 weeks later?
(b) At what time does the rate of infection begin to decline?
(c) If the trend continues, approximately how many people will eventually contract the disease? 7,343 people had
contracted the disease by the second week. (b) = t=2.454, so the epidemic begins to fade about 2.5 weeks after
it starts. (c) Q(t) approaches 20 as t increases without bound, it follows that approximately 20,000 people will
eventually contract the disease.
Answer by Solver92311(821)  (Show Source): (Show Source):
Question 1182256: The red blood cell counts (in millions of cells per microliter) for a population of adult males can be approximated by a normal distribution, with a mean of 5.9 million cells per microliter and a standard deviation of 0.4 million cells per microliter.
(a) What is the minimum red blood cell count that can be in the top 23% of counts?
(b) What is the maximum red blood cell count that can be in the bottom 14% of counts?
(a) The minimum red blood cell count is________
nothing million cells per microliter?
(Round to two decimal places as needed.)
Answer by Boreal(15235) (Show Source):
You can put this solution on YOUR website! the 77th percentile for a normal distribution is z=+0.739
z=(x-mean)/sd
0.739=(x-5.9)/0.4
0.296=x-5.9
x=6.196 million
-
z(0.14)=-1.080
-1.080=(x-5.9)/0.4
-0.432=x-5.9
x=5.468 million
Question 1171969: A psychologist finds that the intelligence quotients of a group of patients are
normally distributed, with a mean of 102 and a standard deviation of 16. Find
the percent of the patients with IQs
a) above 114.
b) between 90 and 118.
Answer by VFBundy(438)  (Show Source): (Show Source):
Question 1168799: Consider a normal distribution curve where 70-th percentile is at 15 and the 15-th percentile is at 1. Use this information to find the mean, 𝜇 , and the standard deviation, 𝜎 , of the distribution.( i don't know where or how to start this i am soooooooooooo lost
a) 𝜇=
b) 𝜎=
Answer by Boreal(15235) (Show Source):
You can put this solution on YOUR website! You want to get two equations in 2 unknowns, like simultaneous equations.
z=(x-mean)/sd. There are four variables, and the x and z are both known, once the percentiles are used to calculate z.
can use invnorm function on calculator 2nd VARS 3 invnorm(0.15,0,1) ENTER
to get z=-1.036 for the 15th percentile (the table could be used, too)
the 70th percentile is z=+0.524
z=(x-mean)/sd
using the first above -1.03=(1-mean)/sd; from the second, 0.5244=(15-mean)/sd
-1.036 sd=1-mean
mean-1.036 sd=1
and
0.524 sd=15-mean
mean+0.544 sd=15
subtract second from first
-1.56 sd=-14
sd=8.97
use first -1.03(8.97)=1-mean
mean=10.29
so mean is 10.29
sd is 8.97
can check in the second equation or use the calculator 2ndVARS 2 normalcdf(1,15,10.30,8.97) looking for an answer of 0.55, since the area in between the 15th and 70th percentiles is 55%. I get 54.99%, which is reasonable given rounding.
If one uses two decimal place z values, which is common, the sd will be a little different.
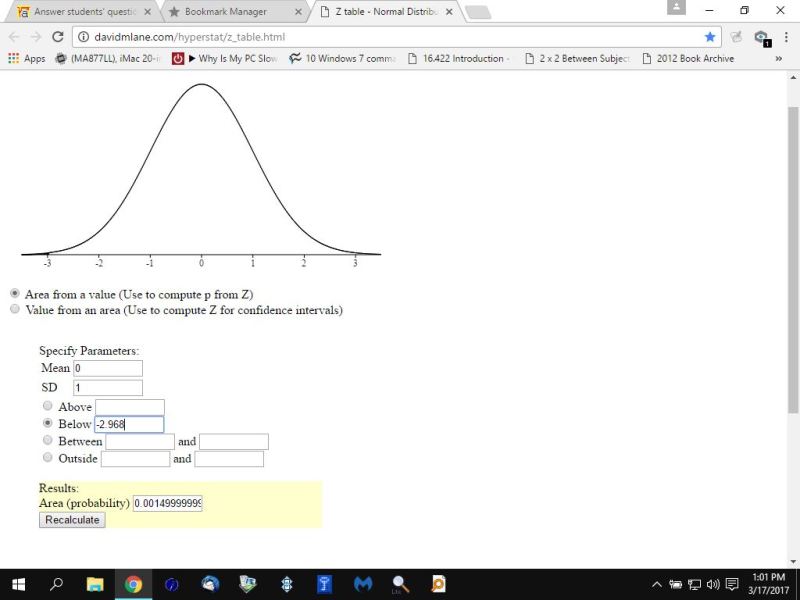
Question 1168458: find area under normal curve
below z = -2.54
EQUIVALENT:
-2.54 = 0.4945
how do i get the area "BELOW" of its z score?
Answer by solver91311(24713)  (Show Source): (Show Source):
Question 1168457: find area under normal curve
above z = 1.28
EQUIVALENT:
1.28 = 0.3962
how do i get the area "ABOVE" of its z score?
Answer by Boreal(15235) (Show Source):
You can put this solution on YOUR website! The z-score of 1.28 corresponds to probability 0.8997. That is probability of everything to the left or all z-scores LESS than 1.28.
The area above that z-score is the complement or 1-0.8997 or 0.1003 or 10.03%.
Can do on calculator VARS2Normalcdf(1.28, 6)ENTER. Note, you can use any number higher than 6--it represents SD, Don't ever need to use normal pdf .
1.28 is a useful z-value, as is 1.645, 1.96,2.328, and 2.576.
Question 1162941: Determine the following percentages for a z score of 0.90 (Round your answers to 2 decimal places
a. The percentage of scores fall below this z score.
b. The percentage of scores fall between the mean and this z score.
c. The percentage of scores above this z score
Answer by Theo(13342) (Show Source):
Question 1162942: Determine the z-score associated with the following percentages
a. 19% from the mean to Z
b. 41% in the tail
c. 50% in the tail
Answer by Boreal(15235) (Show Source):
You can put this solution on YOUR website! This is between 0.31 and 0.69 probability or between -0.496 and +0.496 for z
This is at probability 0.59 or 0.41 or -0.24 for z (left tail) and +0.24 for z (right tail)
50% in the tail would be z=0, at the mean.
Question 1162943: Determine the percentage of scores for the following (Round your answer to the nearest percentage)
a) Between z of -1.10and a z of 0.35
b) Below a z of 0.85
c) Between a z of 0.52 and a z of 1.52
Answer by Boreal(15235) (Show Source):
Question 1159795: Test scores are normally distributed with a mean of 76 and a standard deviation of 10.
a. In a group of 230 tests, how many students score above 96?
b. In a group of 230 tests, how many students score below 66?
c. In a group of 230 tests, how many students score within one standard deviation of the mean?
Answer by Edwin McCravy(20081)  (Show Source): (Show Source):
You can put this solution on YOUR website!
a. In a group of 230 tests, how many students score above 96?


On your TI-84, 2ND VARS

normalcdf(96,1E99,76,10)  <-- the "E" to use is 2ND then the comma key

0.022759962

multiply by 230

5.232514263

Round down to 5 students.

-------------------------

b. In a group of 230 tests, how many students score below 66?

normalcdf(-1E99,66,76,10)

0.1586552596

multiply by 230

36.4907097

Round down to 36 students.

--------------------------

c. In a group of 230 tests, how many students score within one standard deviation of the mean?

That's between 76-10=66 and 76+10=86

normalcdf(66,86,76,10)

0.682689809

multiply by 230


157.0185806

Round down to 157 students.


Edwin
Question 1158686: A class is given an exam. The distribution of the scores is normal. The mean score is 80 and the standard deviation is 7. Determine the test score, c, such that the probability of a student having a score less than c is 90 %.
P(x < c) = 0.9
Find c rounded to one decimal place.
Answer by Boreal(15235) (Show Source):
You can put this solution on YOUR website! z=(x-mean)/sd
when z=1.645, have the 90th percentile score
1.645*7=x-mean
11.5=x-mean
x=91.5
Below that score will be 90% of the scores or P(x<90.5)=0.9
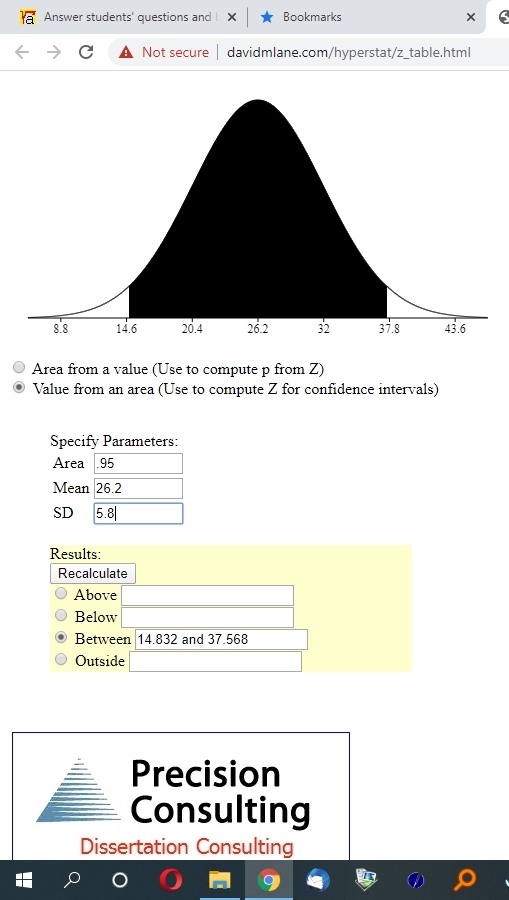
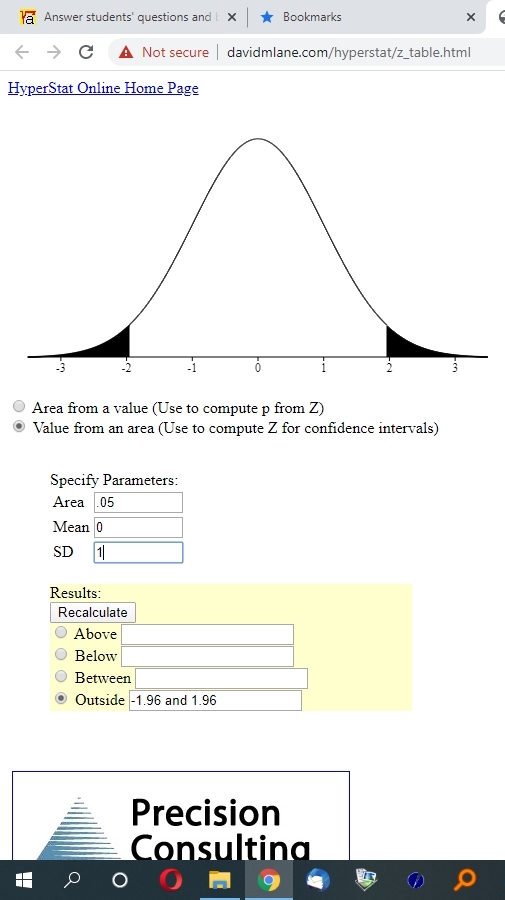
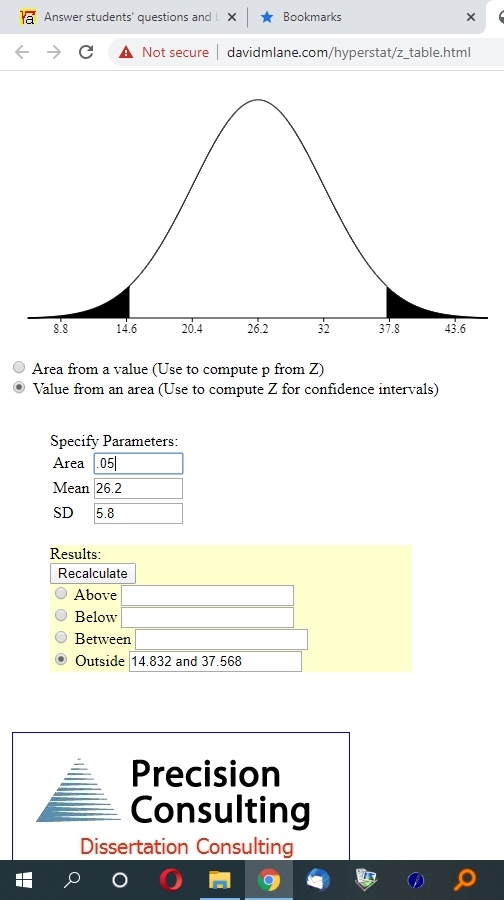
Question 1155349: Fuel economy estimates for automobiles built in a certain year predicted a mean of 26.2 mpg and a standard deviation of 5.8 mpg for highway driving. Assume that a normal distribution can be applied. Within what range are 95% of the automobiles?
Answer by Theo(13342) (Show Source):
Question 1153636: Identity the relationship among Tn,Sn and Sn-1 where n>1 and ∈ N
Answer by ikleyn(53763) (Show Source):
Question 1147103: a random sample of size 35 is drawn from a normal distribution with mean 30 and variance 25. what is the probability that the sample mean is at least 28?
Answer by rothauserc(4718)  (Show Source): (Show Source):
You can put this solution on YOUR website! Use the Normal Distribution and table of z-values
:
standard deviation = square root(25) = 5
:
standard error = 5/square root(35) = 0.8452
:
z = (28 - 30)/0.8452 is approximately -2.37
:
The probability(P) associated with the z value is 0.0089
:
P(X > or = 28) = 1 - 0.0089 = is approximately 0.9911
:
Question 1131015:
Answer by Alan3354(69443)  (Show Source): (Show Source):
Question 1124670: The density of pure gold (Au) is 19.3 g/cm3. What is the mass of a block of gold that measures 1.2 cm x 5.00 cm x 3.20 cm? Please show work.
Answer by Boreal(15235) (Show Source):
Question 1124182: What is the volume of 96g of ether, if the density of ether is 0.70g/ml?
Answer by josgarithmetic(39799) (Show Source):
Question 1121340: find the minimum and the maximum points of a functions
f(x)= 6x^3+7x^2-3x+1
Answer by Boreal(15235) (Show Source):
You can put this solution on YOUR website! Take the derivative and set it equal to 0.
18x^2+14x-3=0
x=(1/36)(-14+/- sqrt (196+216); sqrt 412=20.3
x= +0.175 and -0.95
f(x)=0.72 and 5.02
at x=0 f(x)=1, so x=0.175 must be a local minimum
second derivate at that value (36x+14) is also positive, consistent with that
x=-0.95 is a local maximum, since second derivative at -0.95 is negative.

Question 1091316:
Answer by ikleyn(53763) (Show Source):
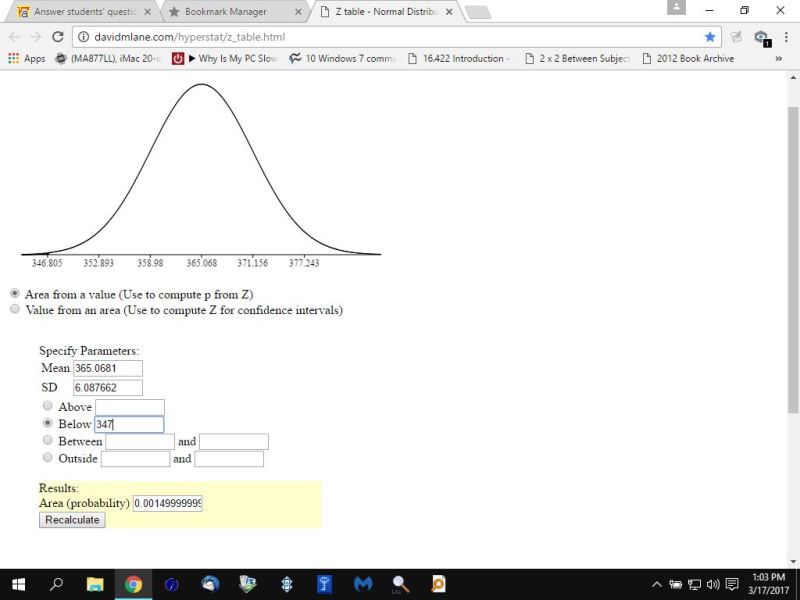
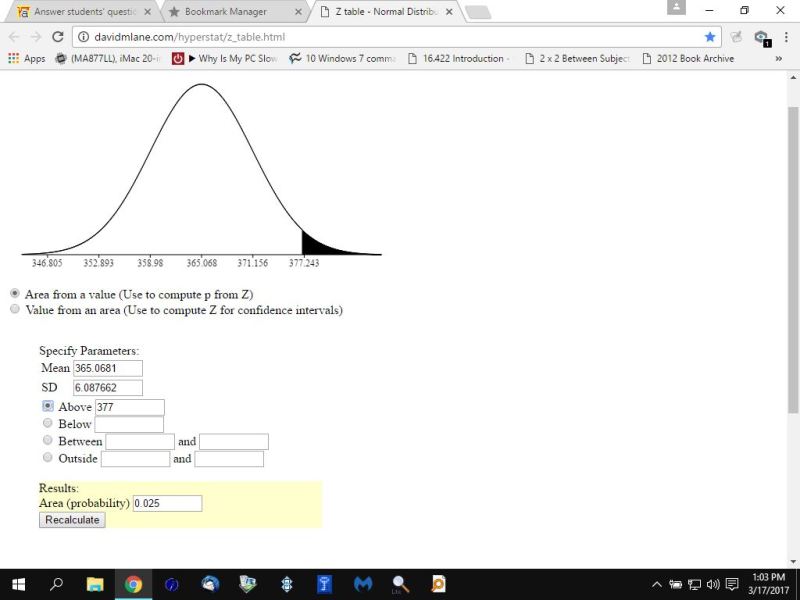
Question 1073285: the weight of a shipment of canned food are normally distributed. if 0.15% of them are lighter than 347 g and 2.5% of them are heavier than 377 g, find mean and the standard deviation of the weights of the canned food
Found 2 solutions by Boreal, Theo:
Answer by Boreal(15235) (Show Source):
You can put this solution on YOUR website! x1=347; x2=377
0.15% is 2.967 sd less than the mean.
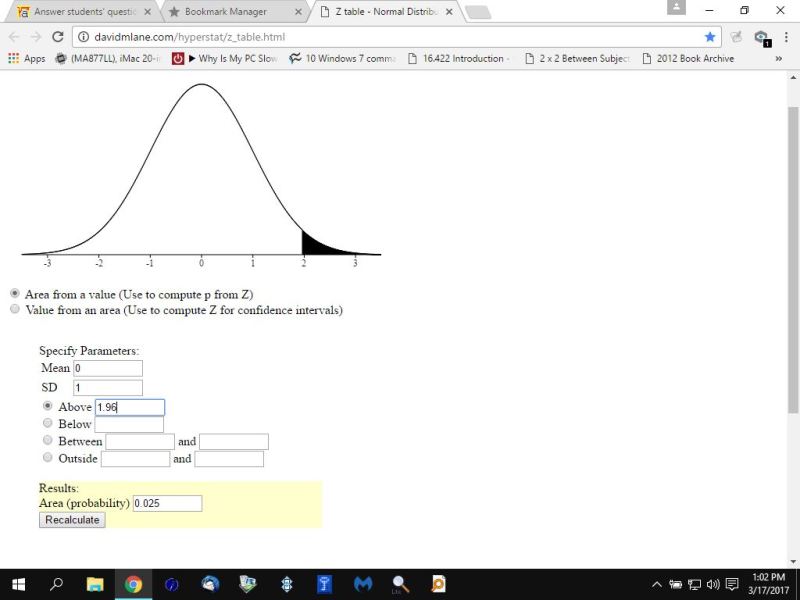
2.5% is 1.96 sd greater than the mean.
z=(x-mean)/sd
1.96*sd=377-mean;mean+1.96 sd=377
-2.967*sd=347-mean; mean-2.967=347
therefore, 377-1.96sd=347+2.967sd
30=4.927 sd
sd=6.089
mean=347+2.967(6.089)=347+18.1=365.1
mean=377-1.96(6.089)=377-11.93=365.1
mean is 365.1
sd is 6.09
Answer by Theo(13342) (Show Source):
|
|