|
Question 54302: I have a graph problem that has to be plotted. How can you help me solve this problem?
Lost--
Sher
Answer by funmath(2933)   (Show Source): (Show Source):
You can put this solution on YOUR website! Hi Sher,
If you're graphing a linear equation (I assume that's what you're doing because that's what they start you off with.)then you can plot a couple of points, or as many as your teacher feels is necessary and connect the dots. I'll try to show you an example.
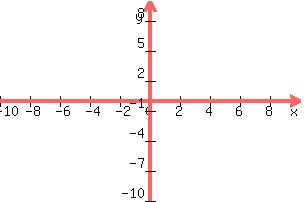
First, take a look at the rectangular cartesian graph. The horizontal line (the one going left to right) is the x-axis and the vertical line (the one going up and down) is the y axis. Going right of the origin gives positive x's, to the left is negative x's. Going to up fromt the origin gives is positive y's going down gives negative y's.
If you needed to graph a point (x,y)=(2,3) You'd go right 2 on the x-axis and then from there 3 units up then put your point there.
For an example problem lets graph y=x+1.
You can pick any number you want for x, you want to pick one that is easy to fit on your graph.
Let x=(-1) Substitute -1 where x is in your equation and solve for y.
y=(-1)+1=0 Plot(-1,0)
Let x=0
y=0+1=1 Plot(0,1)
Let x=1
y=2+1=3 Plot (1,3)
Connect the dots and you have a line that looks like:

Hope that helps.
Happy Calculating!!!
|
|
|
| |