14.3
57.85
72.6
93.6
198.6
the basic box plot gives you:
the minimum
the first quartile
the median
the third quartile
the maximum
here's a picture of the basic boxplot
http://www.physics.csbsju.edu/stats/box2.html
based on that, your numbers are:
14.3 = minimum
57.85 = first quartile
72.6 = median
93.6 = third quartile
198.6 = maximum
the first quartile tells you that 25% of the numbers are less than that and 75% of the number are greater than that.
the median tells you that 50% of the numbers are less than that and 50% of the number are greater than that.
the third quartile tells you that 75% of the number are less than that and 25% of the numbers are greater than that.
the basic box plot divides the distribution into 4 quarters.
25% of the number are between the minimum and the first quartile.
25% of the numbers are between the first quartile and the median.
25% of the number are between the median and the third quartile.
25% of the numbers are between the third quartile and the maximum.
50% of the number are between the first quartile and the third quartile.
the difference between the first quartile and the third quartile is called the inter-quartile range.
your problem states:
These are the numbers under the boxplot.
$14.3 mil, $57.85 mil, $72.6 mil, $93.6 mil, $198.6 mil.
Fill in the blanks:
a) _____% of the MLB teams have payroll salaries greater than $72.6 million.
b) _____% of the MLB teams have payroll salaries greater than $93.6 million.
since 72.6 mil is the median, then 50% of the numbers are below and 50% of the numbers are above 72.6 mil.
since 93.6 mil is the third quartile, then 75% of the numbers are below and 25% of the numbers are above 93.6 mil.
answer to question a is 50%.
answer to question b is 25%.
a picture of your box plot would look like this:
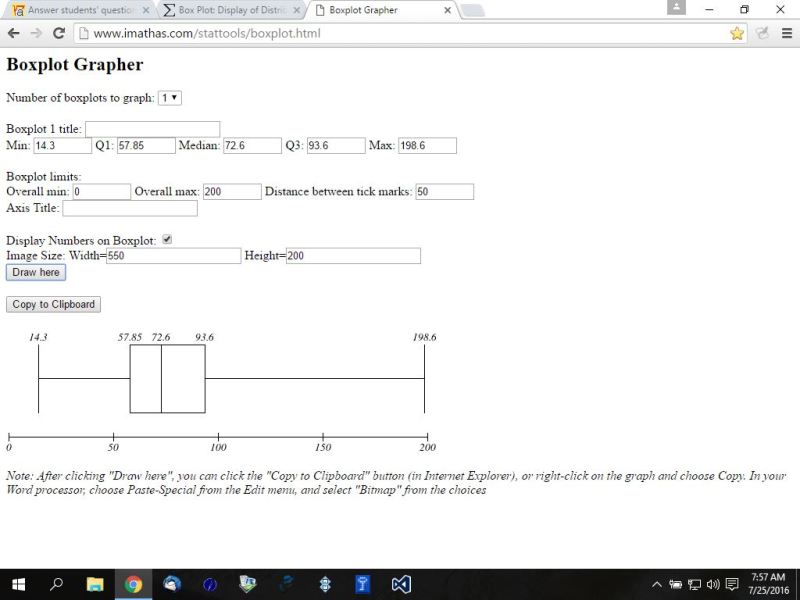
the link to the box plot grapher is shown below.
http://www.imathas.com/stattools/boxplot.html