Tutors Answer Your Questions about Correlation (FREE)
Question 1169528: n=10
x=755
y=819
xy=62085
x^2=68025
y^2=68109
If the level of significance is 0.01 and r=0.24 how to compute test statistic? (step 3 in correlation process)
Test Statistic:n=? __?__ -test
Answer by CPhill(1987)   (Show Source): (Show Source):
You can put this solution on YOUR website! Absolutely! Let's break down how to compute the test statistic for a correlation coefficient.
**Understanding the Problem**
We are given:
* $n = 10$ (sample size)
* $r = 0.24$ (correlation coefficient)
* Significance level ($\alpha$) = 0.01
We need to calculate the test statistic for the correlation coefficient.
**Formula for the Test Statistic**
The test statistic for a correlation coefficient is calculated using the following formula:
$$t = \frac{r\sqrt{n-2}}{\sqrt{1-r^2}}$$
**Step-by-Step Calculation**
1. **Calculate $r^2$:**
$$r^2 = (0.24)^2 = 0.0576$$
2. **Calculate $1 - r^2$:**
$$1 - r^2 = 1 - 0.0576 = 0.9424$$
3. **Calculate $\sqrt{1 - r^2}$:**
$$\sqrt{1 - r^2} = \sqrt{0.9424} \approx 0.97077$$
4. **Calculate $\sqrt{n - 2}$:**
$$\sqrt{n - 2} = \sqrt{10 - 2} = \sqrt{8} \approx 2.8284$$
5. **Calculate $r\sqrt{n - 2}$:**
$$r\sqrt{n - 2} = 0.24 \times 2.8284 \approx 0.6788$$
6. **Calculate the test statistic $t$:**
$$t = \frac{0.6788}{0.97077} \approx 0.6992$$
**Result**
Therefore, the test statistic is approximately 0.6992.
**Final Answer**
Test Statistic: n=10 t-test = 0.6992
Question 1170317: An architect wants to determine the relationship between the heights (in feet) of a building and the number of stories in the building. The data for a sample of 10 buildings are shown below. Explain the relationship.
Stories 64 54 40 31 45 38 42 41 37 40
Height 841 725 635 616 615 582 535 520 511 485
Answer by CPhill(1987) (Show Source):
You can put this solution on YOUR website! To explain the relationship between the height of a building and the number of stories, we can analyze the data and look for patterns. Here's how we can approach this:
**1. Visual Inspection and Intuition**
* Looking at the data, it seems like generally, as the number of stories increases, the height of the building also increases. This suggests a positive relationship.
**2. Organizing the Data**
It's helpful to organize the data in a table:
| Stories | Height (feet) |
| :---------: | :---------------: |
| 64 | 841 |
| 54 | 725 |
| 40 | 635 |
| 31 | 616 |
| 45 | 615 |
| 38 | 582 |
| 42 | 535 |
| 41 | 520 |
| 37 | 511 |
| 40 | 485 |
**3. Analyzing the Relationship**
* **Positive Trend:** As mentioned earlier, there's a general positive trend. Higher story counts tend to correspond to greater heights. However, the relationship isn't perfectly linear. For example, the buildings with 40 stories have heights of 635 and 485, showing some variation.
* **Not Perfectly Linear:** The height doesn't increase by a constant amount for each additional story. The difference in height between buildings with consecutive story counts varies.
* **Potential Outliers:** We might consider the building with 45 stories and a height of 615 as potentially not fitting the general trend as well.
**4. Describing the Relationship**
Based on the analysis, we can describe the relationship as:
* There is a **positive correlation** between the number of stories in a building and its height. This means that taller buildings generally have more stories.
* The relationship is **not perfectly linear**. The increase in height per story is not constant. There's some variability in the data.
* Other factors besides the number of stories likely influence a building's height, such as ceiling height, architectural design, and zoning regulations.
**In summary:** The data indicates a general tendency for taller buildings to have more stories, but the relationship is not a precise one-to-one correspondence.
Question 1170330: An architect wants to determine the relationship between the heights (in feet) of a building and the number of stories in the building. The data for a sample of 10 buildings are shown below. Explain the relationship.
Stories 64 54 40 31 45 38 42 41 37 40
Height 841 725 635 616 615 582 535 520 511 485
Answer by josgarithmetic(39623) (Show Source): (Show Source):
You can put this solution on YOUR website! Try making a graph! If the ordered pairs seem too hard to fix for graph paper, try some kind of software.
If you want a good straight line, the last two points may give a good or great choice.
https://imgur.com/a/IcmH2a8
[url=https://imgur.com/Y7nB4ST][img]http://i.imgur.com/Y7nB4ST.png[/img][/url]
[img]https://i.imgur.com/Y7nB4ST.png[/img]
Question 1181445: On the basis of the following information of x and y series consisting of 15 pairs of observations calculate of correlation coefficient :
x -series : X = 25 ÁËx 3.01
y -series : Y = 18 ÁËy3.03
Summation of products of corresponding deviation of x and y series = 122.
Answer by CPhill(1987) (Show Source):
You can put this solution on YOUR website! Here's how to calculate the correlation coefficient (r) with the provided information:
**1. Calculate the means of x and y:**
* Mean of x (xä) = öÈx / n = 25 / 15 = 1.67 (approximately)
* Mean of y (à°) = öÈy / n = 18 / 15 = 1.2 (approximately)
**2. Calculate the standard deviations of x and y:**
The provided values (3.01 and 3.03) seem to be related to the sum of squared deviations, not the standard deviations directly. The formula for standard deviation is:
s = sqrt[ öÈ(xÃç - xä)ôý / (n - 1) ]
Since we're given what looks like the square root of the sum of squared deviations, we can infer:
* Standard deviation of x (sã) = 3.01 / sqrt(14) ã 0.802
* Standard deviation of y (sÃçÏ) = 3.03 / sqrt(14) ã 0.807
**3. Calculate the correlation coefficient (r):**
The formula for the correlation coefficient is:
r = öÈ[(xÃç - xä)(yÃç - à°)] / [ (n - 1) * sã * sÃçÏ ]
We're given that the summation of products of corresponding deviations is 122. This is the numerator of the formula. Therefore:
r = 122 / [ (15 - 1) * 0.802 * 0.807 ]
r = 122 / [ 14 * 0.647 ]
r = 122 / 9.058
r ã 13.47
**Important Note:** The calculated correlation coefficient (r ã 13.47) is outside the possible range of -1 to +1. This indicates there might be an issue with the provided data. It's likely the values 3.01 and 3.03 are not what they seem to be (perhaps they represent the sum of squared deviations and not a value related to standard deviation). Double-check the source of the data to ensure accuracy. If the 3.01 and 3.03 values are the sum of squared deviations, then the standard deviations would be 3.01/sqrt(14) and 3.03/sqrt(14) respectively. This would give the correct correlation coefficient.
Question 1187210: Q No.6)
Part a)
The following table shows verbal reasoning test score, x, and an English test score, y, for each of a random sample of 8 children who took both tests.
Child A B C D E F G H
x 112 113 110 113 112 114 109 113
y 69 65 75 70 70 75 68 76
Calculate the Co-efficient of correlation ãrã between the scores in verbal reasoning and English.
Part b)
The age (X) and systolic blood pressure (Y) of 100 individuals gave the following sums:
ÿËX i ÿ§ 4421, ÿËYi ÿ§ 12130, ÿËX i2 ÿ§ 208349, ÿËYi2 ÿ§1498976, ÿËX iYi ÿ§ 542735
Determine the equation of the least squares regression line of Y on X.
the missing letter is sumation (E)
Answer by CPhill(1987) (Show Source):
You can put this solution on YOUR website! Part a) Correlation Coefficient (r)
Here's how to calculate the correlation coefficient (r) for the verbal reasoning (x) and English (y) test scores:
Calculate the means of x and y:
Mean of x (xä) = (112 + 113 + 110 + 113 + 112 + 114 + 109 + 113) / 8 = 111.75
Mean of y (à°) = (69 + 65 + 75 + 70 + 70 + 75 + 68 + 76) / 8 = 71
Calculate the deviations from the mean for x and y:
For each x value, calculate (x - xä)
For each y value, calculate (y - à°)
Child x y x - xä y - à°
A 112 69 0.25 -2
B 113 65 1.25 -6
C 110 75 -1.75 4
D 113 70 1.25 -1
E 112 70 0.25 -1
F 114 75 2.25 4
G 109 68 -2.75 -3
H 113 76 1.25 5
Export to Sheets
Calculate the products of the deviations:
Multiply (x - xä) and (y - à°) for each child.
Child x - xä y - à° (x - xä)(y - à°)
A 0.25 -2 -0.5
B 1.25 -6 -7.5
C -1.75 4 -7
D 1.25 -1 -1.25
E 0.25 -1 -0.25
F 2.25 4 9
G -2.75 -3 8.25
H 1.25 5 6.25
Export to Sheets
Calculate the sum of the products of deviations (öÈ(x - xä)(y - à°)):
Sum the values in the last column: -0.5 + (-7.5) + (-7) + (-1.25) + (-0.25) + 9 + 8.25 + 6.25 = 7
Calculate the sum of squared deviations for x and y:
öÈ(x - xä)ôý = (0.25)ôý + (1.25)ôý + (-1.75)ôý + (1.25)ôý + (0.25)ôý + (2.25)ôý + (-2.75)ôý + (1.25)ôý = 14.75
öÈ(y - à°)ôý = (-2)ôý + (-6)ôý + 4ôý + (-1)ôý + (-1)ôý + 4ôý + (-3)ôý + 5ôý = 96
Calculate the correlation coefficient (r):
r = öÈ(x - xä)(y - à°) / sqrt[öÈ(x - xä)ôý * öÈ(y - à°)ôý]
r = 7 / sqrt(14.75 * 96)
r = 7 / sqrt(1416)
r ã 7 / 37.63
r ã 0.186
Part b) Least Squares Regression Line
The equation of the least squares regression line of Y on X is given by:
y = a + bx
where:
b = (öÈXÃçÂYÃç - (öÈXÃç * öÈYÃçÂ) / n) / (öÈXÃçÂôý - (öÈXÃçÂ)ôý / n)
a = à° - b * xä
Given:
öÈXÃç = 4421
öÈYÃç = 12130
öÈXÃçÂôý = 208349
öÈYÃçÂôý = 1498976
öÈXÃçÂYÃç = 542735
n = 100
Calculate b:
b = (542735 - (4421 * 12130) / 100) / (208349 - (4421)ôý / 100)
b = (542735 - 536497.3) / (208349 - 195452.41)
b = 6237.7 / 12896.59
b ã 0.484
Calculate the means of X and Y:
xä = öÈXÃç / n = 4421 / 100 = 44.21
à° = öÈYÃç / n = 12130 / 100 = 121.3
Calculate a:
a = à° - b * xä
a = 121.3 - (0.484 * 44.21)
a = 121.3 - 21.41
a ã 99.89
Therefore, the equation of the least squares regression line of Y on X is:
y = 99.89 + 0.484x
Question 1187211: The nine items of a sample had the following values:
45, 47, 50, 52, 46, 40, 49, 55, 66
Does the mean of the nine items differ significantly from an assumed normal population mean of 45 i.e., ÿÙ ÿ§ 45 at ÿÀ ÿ§ 0.05?
Answer by Boreal(15235)  (Show Source): (Show Source):
You can put this solution on YOUR website! the difference is a t-test with t(df=8, 0.975) = 2.306 assuming an alpha=0.05
x bar=48.89
s=5.06
t=difference in means/s/sqrt(n)
=3.89*sqrt(9)/5.06
=2.306
reject at the 5% level, p-value is 0.05005
the question says 0.05, and that is the above.
Question 1188022: Determine the relation of these two sets ( = , or e , or C ).
a) {8}, {8, 8}
Answer by Solver92311(821)  (Show Source): (Show Source):
Question 1170562: Each box of one brand of breakfast cereal contains a coupon entitling purchasers to a free package of vegetable seeds. At the home office, they use the weight of the incoming mail to determine the number of employees to be assigned to collecting coupons and sending out seed packages each day. (The company policy is that all mail received will be answered the same day.) Following is the data for a random sample of 8 days:
Weight of mail (pounds) 11 20 16 6 12 18 23 25
Number of employees 6 10 9 5 8 14 13 16
(a) Draw a scatter diagram for the data-discuss its shape (5 marks)
(b) Using Excel conduct the following regression models for the data
I. LineaR
II. Quadratic
III. Third degree polynomial
IV. Exponential
V. Logarithmic
VI. Power
(c) Determine which model is the best-state the reason for your belief. (5 marks)
(d) What percentage of the variation in the number of employees is explained by the regression model chosen.
(e) If the company receives 15 pounds of mail, how many employees should be assigned mail duty?
Answer by math_tutor2020(3817) (Show Source):
Question 1147032: find two angles, one positive and one negative, that are coterminal with each given angle. 500 degrees
Answer by ikleyn(52835)  (Show Source): (Show Source):
You can put this solution on YOUR website! .
1)  one positive . . .


    First thing that comes to the mind is 500 degrees, the same angle.


    But if you want to have "other" angle,  you may add 360 degrees as many times as you want.


    Or you can subtract 360 degrees until the angle measure is still positive.


    By subtracting, you get  500 - 360 = 140 degrees, which is your answer in this case.


    Notice that this angle of 140 degrees is in the range between 0 (zero) and 360 degrees.

    It is called principal coterminal angle to the given angle.


2)  One negative . . .


    Subtract 360 degrees from 500 degrees as many time as you want, until the measure of the angle is negative.


    Subtracting one time is not enough, but subtracting TWO TIMES gives you the angle

        500 - 360 - 360 = -220 degrees.


    Notice that this angle of -220 degrees is in the range between 0 and -360 degrees.


    It is your answer in this case.
Solved, explained and completed.
Question 1141745: What percentage of scores fall between -1 and +1 standard deviation units on a normal curve? How do you know this?
Found 2 solutions by Edwin McCravy, VFBundy:
Answer by Edwin McCravy(20060)  (Show Source): (Show Source):
You can put this solution on YOUR website!
On your TI 83 or 84,

press 2ND
press VARS
highlight 2:normalcdf
press ENTER

if you have a newer model 84 calculator, make it read this way

         lower:-1
         upper: 1
         m:0
                  s:1
         Paste

Press ENTER

You'll read

normalcdf(-1,1,0,1)

press ENTER, read 0.6826894809

If you have an older model 84 or an 83, make it read

normalcdf(-1,1,0,1)

press ENTER, read 0.6826894809

Edwin
Answer by VFBundy(438)  (Show Source): (Show Source):
You can put this solution on YOUR website! A z-score that is 1 standard deviation above the mean is +1.0. When you look up +1.0 on a z-table, you get 0.8413. These are the percentage of scores under the curve that are less than +1 standard deviations.
A z-score that is 1 standard deviation below the mean is -1.0. When you look up -1.0 on a z-table, you get 0.1587. These are the percentage of scores under the curve that are less than -1 standard deviations.
To find where these scores intersect...that is, the percentage of scores between -1 and +1 standard deviations...you simply subtract the difference. So, 0.8413 minus 0.1587 is 0.6826.
So, 0.6813 of the scores fall between -1 and +1 standard deviations.
Question 1141095: Find the third degree polynomial function with real coefficients and the given zeros for 2,2+i
Answer by josgarithmetic(39623) (Show Source):
Question 1140921: How to solve pqr p(0, 1), q(3, 2), and r(5, -4)
Answer by Alan3354(69443)  (Show Source): (Show Source):
Question 1130135: Find two integers whose sum is -7 and whose product is 12.
Found 3 solutions by greenestamps, ankor@dixie-net.com, ikleyn:
Answer by greenestamps(13203)  (Show Source): (Show Source):
You can put this solution on YOUR website!
Solve mentally in a few second using logical reasoning.
(1) The product is positive, so the two integers must have the same sign.
(2) The sum is negative, so the two integers must both be negative.
So ignore the signs for the moment, and find two (positive) integers whose sum is 7 and whose product is 12. Then apply the negative signs to those two integers.
Answer by ankor@dixie-net.com(22740)  (Show Source): (Show Source):
You can put this solution on YOUR website! Find two integers whose sum is -7
a + b = -7
b = -a - 7
and whose product is 12.
ab = 12
replace b with (-a - 7)
a(-a-7) = 12
arrange as quadratic equation
-a^2 - 7a - 12 = 0
multiply equation by -1, get rid of all those negatives
a^2 + 7a + 12 = 0
Factors to
(a+3)(a+4) = 0
a = -3, then b = -4
or
a = -4, then b = -3
Answer by ikleyn(52835) (Show Source):
You can put this solution on YOUR website! .
-3 and -4.
---------------
3 seconds to read the problem.
PLUS 3-4 seconds to understand what they want from you.
PLUS 3-4 seconds to get the answer (mentally).
----------------
The other tutor demonstrated you another approach, but when he makes his factoring,
he actually performs THE SAME TRIAL and ERROR guessing as I did mentally.
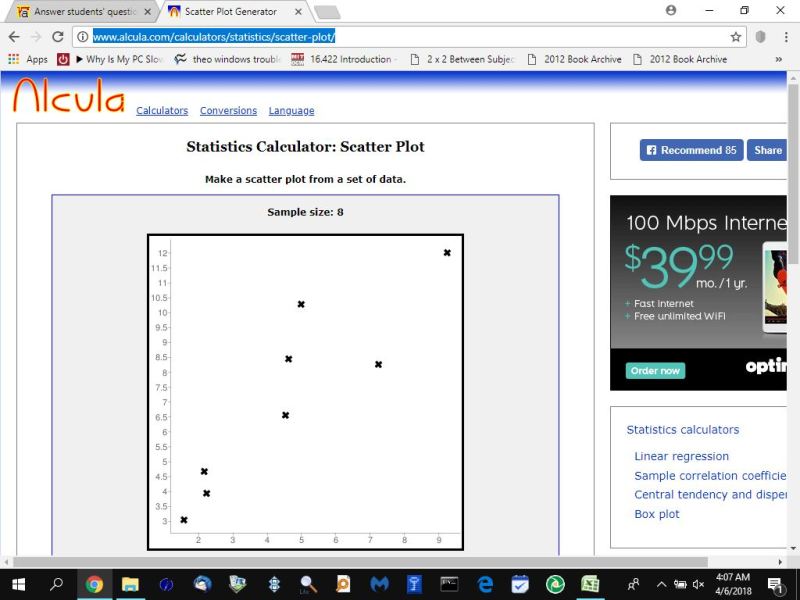
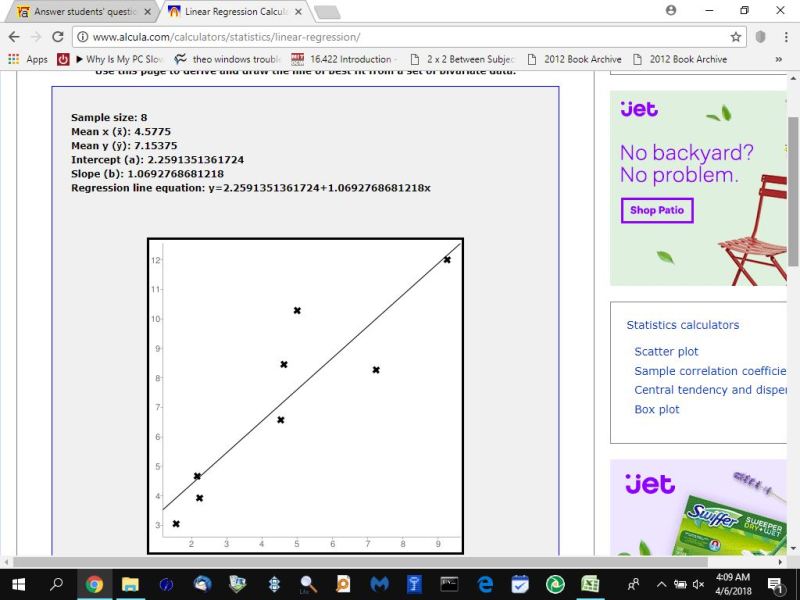
Question 1114067: How strong is the correlation between the inflation rate and 30-year treasury yields? The following data published by Fuji Securities are given as pairs of inflation rates and treasury yields for selected years over a 35-year period.
Inflation rate (%) 30-year treasury yield (%)
1.57 3.05
2.23 3.93
2.17 4.68
4.53 6.57
7.25 8.27
9.25 12.01
5.00 10.27
4.62 8.45
Compute the Pearson productmoment correlation coefficient to determine the strength of the correlation between these two variables. Comment on the strength and direction of the correlation.
Keep 2 decimal places.
r =
There is a strong
relationship between the inflation rate and the thirty-year treasury yield.
Answer by Theo(13342)  (Show Source): (Show Source):
Question 1110415: -4+11=? show on number line
Answer by josgarithmetic(39623) (Show Source):
Question 1026184: 4+3x+5y what is he coefficient
Answer by Fombitz(32388)  (Show Source): (Show Source):
Question 1011927: please help me solve this question
The vertices of a triangle are (1,a)(2,b)(c square,-3):-
(1) Prove that its centroid cannot lie on the Y - axis.
(2) Find the condition that the centroid may lie on the X - axis
Answer by KMST(5328)  (Show Source): (Show Source):
Question 1004295: 1.Is a correlation of +.75 stronger or weaker than a correlation of .90? Explain your answer, and make sure to include a discussion of the components of a correlation: strength and direction.
Answer by Theo(13342) (Show Source):
Question 1003499: The sum of 22 consecutive integers is 6969.
Answer by fractalier(6550)  (Show Source): (Show Source):
Question 975289: With the aim of predicting the selling price of a house in Newburg Park, Florida, from the distance between the house and the beach, we might examine a regression equation relating the two variables. In the table below, the distance from the beach (x, in miles) and selling price (y, in thousands of dollars) for each of a sample of sixteen homes sold in Newburg Park in the past year are given. The least-squares regression equation relating the two variables is yhat=296.54-4.73x. The line having this equation is plotted in Figure 1.
====================
Figure 1
Distance from the beach, x (in miles):
6.8
7.4
14.2
3.8
6.5
11.7
12.1
10.9
9.6
10.6
14.6
8.4
17.8
4.6
13.1
5.5
Selling price, y 9 (in thousands of dollars):
240.0
217.6
188.0
259.0
303.0
222.9
281.7
284.4
233.8
197.6
265.9
296.2
226.0
313.1
200.9
268.4
====================
Based on the above information, answer the following:
(1) For these data, house prices that are greater than the mean of the house prices tend to be paired with distances from the beach that are [greater than or less than?] the mean of the distances from the beach.
(2) According to the regression equation, for an increase of one mile in distance from the beach, there is a corresponding decrease of how many thousand dollars in house price?
(3) What was the observed house price (in thousands of dollars) when the distance (in miles) from the beach was 17.8 miles?
(4) From the regression equation, what is the predicted house price (in thousands of dollars) when the distance (in miles) from the beach is 17.8 miles?
Answer by Fombitz(32388) (Show Source):
Question 972902: A line of best fit goes through points (3,25) and (9,22). Are the points have positive, negative, or no correlation? Explain your reasoning. Thank you! :)
Answer by reviewermath(1029)  (Show Source): (Show Source):
You can put this solution on YOUR website! A line of best fit goes through points (3,25) and (9,22). Are the points have positive, negative, or no correlation? Explain your reasoning
Solution:
The slope of the line is equal to
m =  = = 
Since the slope is negative, the points have a negative correlation.
Question 972944: The line of best fit goes through points (25,3) and (22,9). Are these points have positive, negative, or no correlation? Explain your reasoning. Thank you very much! 😃
Answer by josgarithmetic(39623) (Show Source):
You can put this solution on YOUR website! Including without much statistics knowledge, picking just two points without showing all the others is not enough information to know how good a fit is the line with just those two points. Give all the other points in the set, and someone with statistics knowledge will be able to help.
Question 936580: _________Researchers studying growth patterns of children collect data on the heights of fathers and sons. The correlation between the fathers heights and the heights of their 16 year old sons is most likely to be ...
A) Near Zero
B) Near +0.7
C) Somewhat greater than 1.0
D) Exactly +1.0
E) Near -1.0
Answer by ewatrrr(24785)  (Show Source): (Show Source):
Question 934821: _________The correlation coefficient between high school grade point average (gpa) and college gpa is 0.560. For a student with a high school gpa that is 2.5 standard deviations above the mean, we would expect that student to have a college gpa that is _______________________the mean .
A) 2.5 SD above
B)0.56 SD above
C)equal to
D) 1.4 SD above
Answer by MathLover1(20850)  (Show Source): (Show Source):
Question 934822: ____The correlation coefficient between the hours that a peron is awake during a 24-hour period and the hours that same person is asleep during a 24-hour period is most likely to be
A)Near 0 ; B)Near -0.8 ; C)Near +0.8 ; D)Exactly -1.0 ; E)Exactly +1.0
Found 2 solutions by MathLover1, jim_thompson5910:
Answer by MathLover1(20850) (Show Source):
Answer by jim_thompson5910(35256) (Show Source):
You can put this solution on YOUR website! If
x = # of hours person is awake
y = # of hours person is asleep
then we know that x+y = 24 which turns into y = -x + 24.
We have a perfect linear correlation going on here which means r = -1.0.
The value of r is negative to reflect the fact we have a negative slope.
------------------------------------------------------------------------------------------------------------------------
If you need more one-on-one help, email me at jim_thompson5910@hotmail.com. You can ask me a few more questions for free, but afterwards, I would charge you ($2 a problem to have steps shown or $1 a problem for answer only).
Alternatively, please consider visiting my website: http://www.freewebs.com/jimthompson5910/home.html and making a donation. Any amount is greatly appreciated as it helps me a lot. This donation is to support free tutoring. Thank you.
Jim
------------------------------------------------------------------------------------------------------------------------
Question 934824: _____The correlation coefficient between high school grade point average (gpa) and college gpa is 0.560. For a student with a high school gpa that is 2.5 standard deviations above the mean, we would expect that student to have a college gpa that is ________________________ the mean.
A)2.5 SD above
B)0.56 SD above
C)Equal to
D)1.4 SD above
Found 2 solutions by MathLover1, jim_thompson5910:
Answer by MathLover1(20850) (Show Source):
Answer by jim_thompson5910(35256) (Show Source):
Question 934146: An investigation of a sample of 64 BBA students indicate that the mean time spent on preparing for examination was 48 months and the standard deviation was 15 months. What is the 95% confidence interval time spent by all BBA student before the complete their examination
Answer by ewatrrr(24785) (Show Source):
You can put this solution on YOUR website! Sample of 64: mean = 48 months and the standard deviation was 15 months.
95% confidence interval time
.......
ME = 1.96(15/sqrt(64) = 3.675
CI: 48 Ý 3.675
...
CI: (44.325, 51.675)
round as directed
|
|