|
Question 59508: A- How can the graph for the rule y=2x+1 be used to predict the result for an imput (x- value) of 7? How can the graph be used to predict the output (y- value) associated with an input of 3 1/2?
Found 2 solutions by praseena, chitra:
Answer by praseena(37)   (Show Source): (Show Source):
You can put this solution on YOUR website! you can solve this problem numerically like this,
y=2x+1
when x=7, substitute the x value=7 in the given rule.
y=2*7+1
=14+1
=15
That is when the input is 7, the output is 15.
To predict the output when input is 31/2,
for that, you just put the value x=31/2 in the given rule
that is, y = 2 * 31/2 +1
= 31 + 1= 32
That is when the inputis 31/2, the out put is 32
Answer by chitra(359) (Show Source): (Show Source):
You can put this solution on YOUR website! Solution:
We first plug in for different values of x, to get the corresponding values of y.
Therefore, the table of values are:
X 0 1 2 3 4 5 6 7 8
y 1 3 5 7 9 11 13 15 17
Using these values, we draw the graph of the given straight line.
The graph looks as follows:
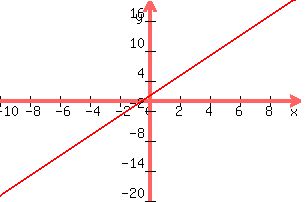
So from the above graph, when x takes the value 7, the value
of y is 15.
So in a similar way when x = 3 1/2, that is 7/2 then the value of y is 8. This point is obtained by plugging in the value of x in the given equation.
Y = 2(7/2) + 1
y = 7 + 1
y = 8
|
|
|
| |