SOLUTION: State the amplitude, midline, period, domain and range of each sinusoidal function then sketch a graph. y=3sin(x)+4

Algebra.Com
Question 1203464: State the amplitude, midline, period, domain and range of each sinusoidal function
then sketch a graph.
y=3sin(x)+4

Found 2 solutions by ikleyn, Theo:
Answer by ikleyn(52781)   (Show Source): You can put this solution on YOUR website!
.
State the amplitude, midline, period, domain and range of each sinusoidal function
then sketch a graph.
y=3sin(x)+4
~~~~~~~~~~~~~~~~~~~~~

amplitude  3.


midline    4.


period     


domain    all real numbers.


range     from -3+4 = 1 to 3+4 = 7:  [1,7].

To make a sketch, go to web-site

www.desmos.com/calculator

Use free of charge plotting tool there.
Print the formula for the function there and get the plot instantly.


Answer by Theo(13342)   (Show Source): You can put this solution on YOUR website!
the general form of the sinusoidal equation is y = a * (b * (x - c)) + d
a is the amplitude.
b is the frequency.
c is the horizontal shift.
d is the vertical shift.

your equation is y = 3 * sin(x) + 4

the amplitude is 3.
the frequency is 1.
the horizontal shift is 0.
the vertical shift is 4.

here is what the graph of the sine wave looks like.


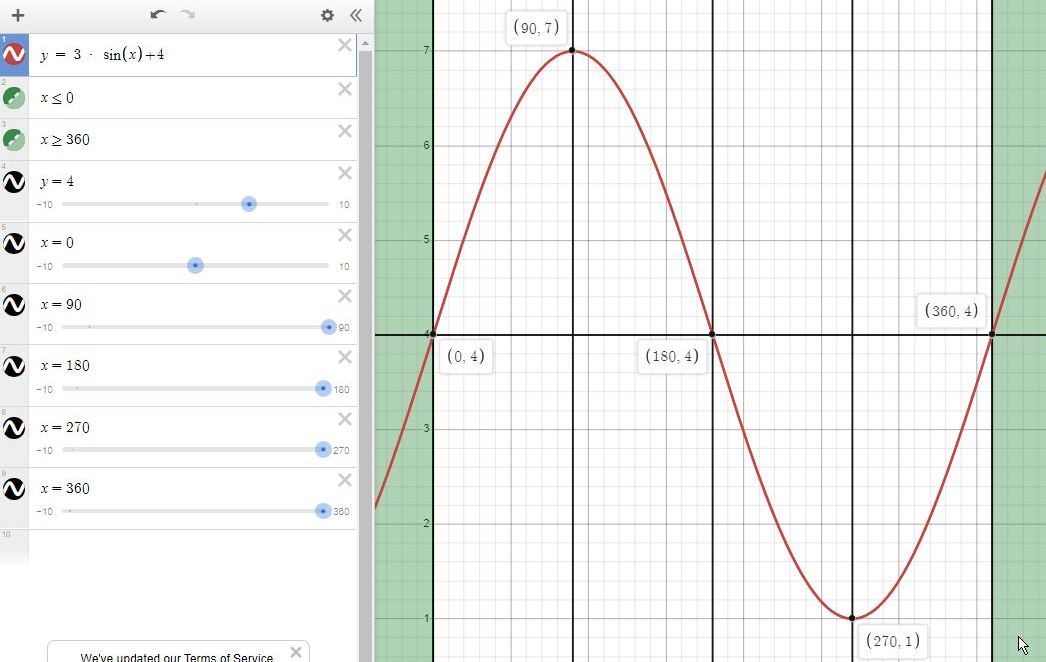
the horizontal center line of the graph is at y = 0 plus the vertical shift.
tht makes y = 4 the center line of this graph.

the amplitude is the distance between the peak of the graph and the horizontal center line of the graph.
the default amplitude is 1.
when it is 3, the graph goes between y = 4 + 3 and y = 4 - 3 on this graph.
that's y = 7 on the high peak and y = 1 on the low peak.

the frequency of the graph is 1 unless otherwise specified.
the normal period for a sine wave is 360 degrees.
the frequency is 360 divided by the frequency.
here it is 360 / 1 = 360 degrees.

the period of the sine wave is 360 divided by the freuency.
since the frequency is 1, the period is 360 / 1 = 360 degrees.

the default values of y = a * sin(x - c)) + d are:
a = 1
b = 1
c = 0
d = 0
they are implied, if not shown.
for example;
y = sin(x) has a = 1, b = 1, c = 0, and d = 0 implied.
explicitly shown, it would be y = 1 * sin(1 * (x - 0)) + 0.

the domain of the graph is x = - infinity to x = + infinity.

here's a reference from the web.

https://mathbitsnotebook.com/Algebra2/TrigGraphs/TGsinusoidal.html#:~:text=A%20sine%20wave%2C%20or%20sinusoid,the%20sine%20function%20in%20trigonometry.&text=(A%20and%20B%20are%20positive,such%20as%20science%20and%20engineering.

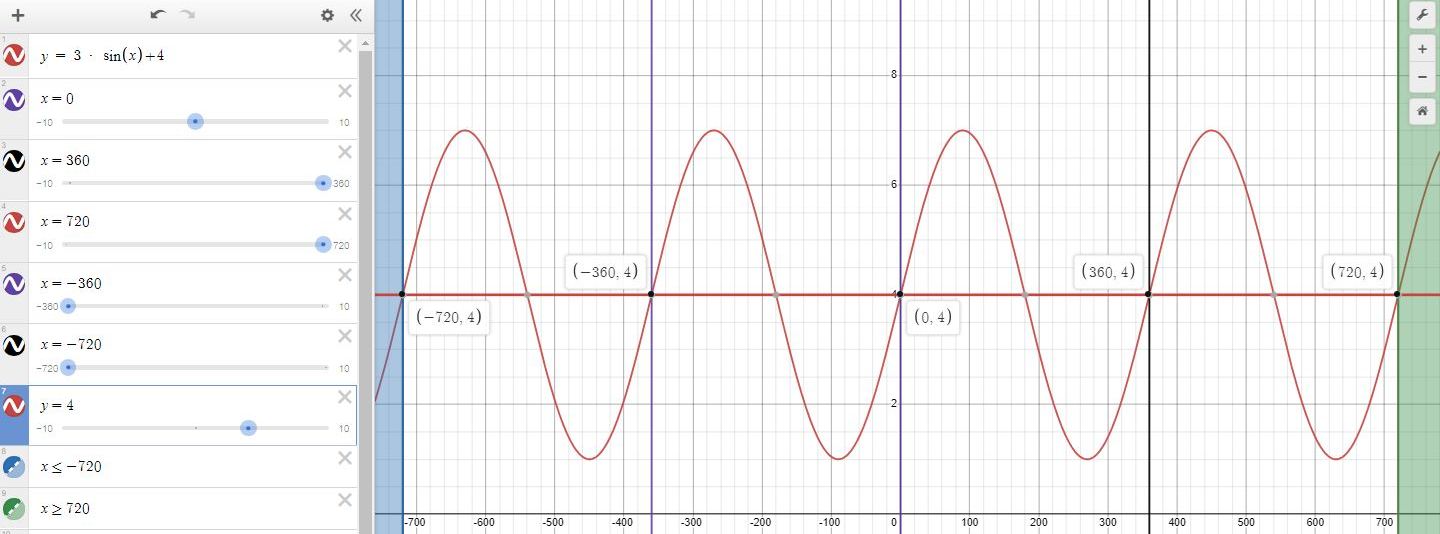
here is what several cycles of your sine wave look like.


RELATED QUESTIONS

Sketch the graph of each of the following. State the range, amplitude, period, and phase... (answered by Alan3354)
7. Sketch graph of each function and state the domain and range y= (x)-4 (answered by mersha)
Sketch a sinusoidal graph with amplitude 2, period 2, and equation of axis y=-4. Sketch... (answered by Boreal)
Graph two full periods of the function. f(x) = 2 cos(𝜋x) WebAssign Plot WebAssign... (answered by MathLover1)
7.) Sketch the graph of each function or relation and state the domain and range. y =... (answered by vleith)
Find the amplitude, period, and phase shift for each function, and sketch its graph. y=... (answered by lwsshak3)
For the sinusoidal function below, give its vertical shift, amplitude, phase shift,... (answered by Alan3354)
Sketch the graph of y=2+3sin(2x+π/4). Include at least 2 full periods. State the... (answered by lwsshak3)
Sinusoidal Functions Without graphing, determine the amplitude, period, equation of the... (answered by greenestamps)