y = acos(b(x-c))+d
a is the amplitude
b is the frequency
c is the horizontal shift
d is the vertical shift.
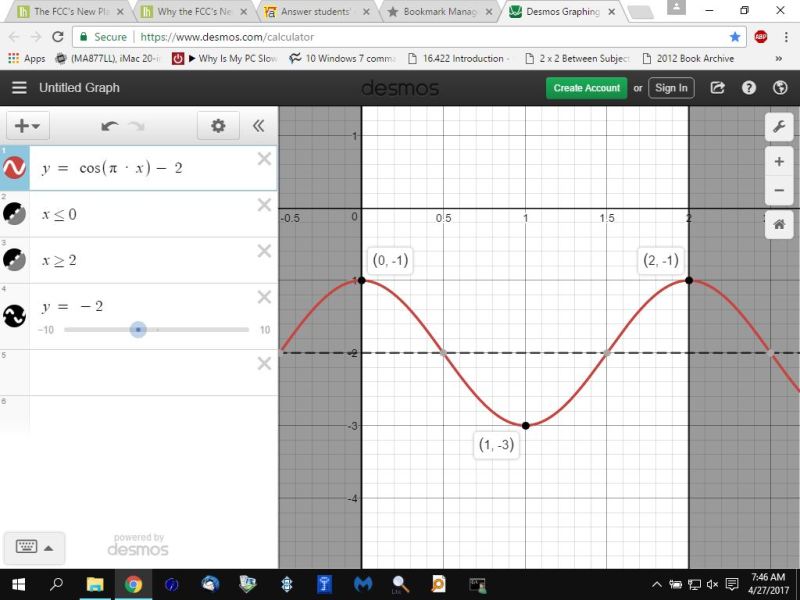
your equation is y = cos(pi * x) - 2
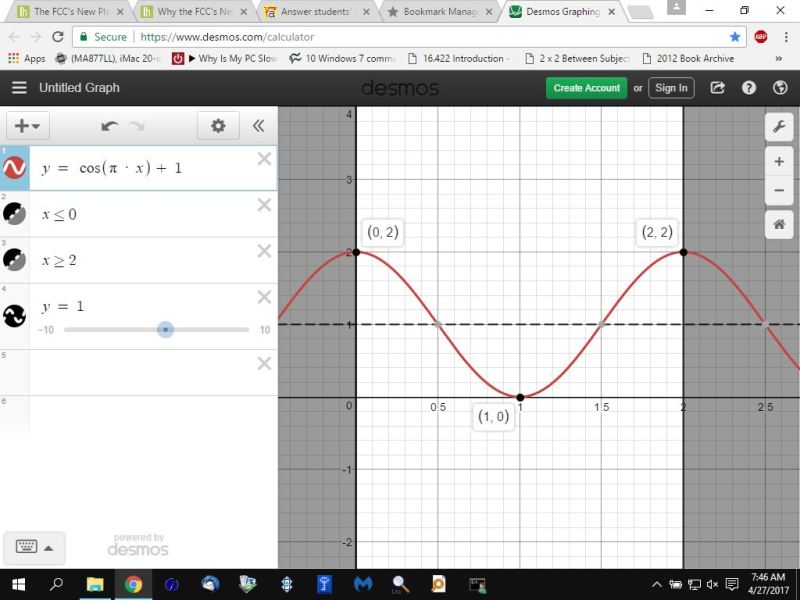
shift it up 3 units and it becomes y = cos(pi * x) + 1
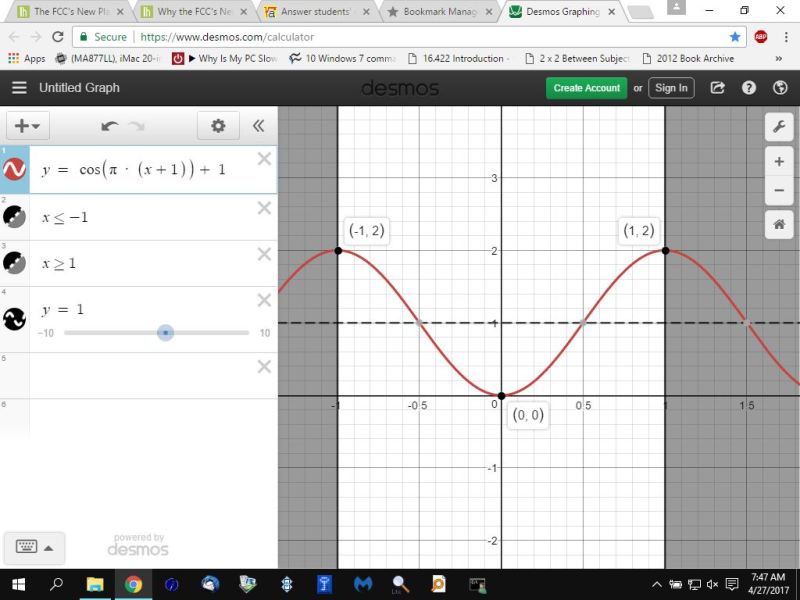
shift it to the left 1 unit and it becomes y = cos(pi * (x+1) + 1
stretch it vertically by a factor of 2 and it becomes y = 2 * cos(pi * (x+1)) + 1
my first graph is the original function.
my second graph shifts the function from the first graph up by 3 units.
my third graph shifts the function from the second graph to the left 1 unit.
my fourth graph vertically expands the third graph by a factor of 2.
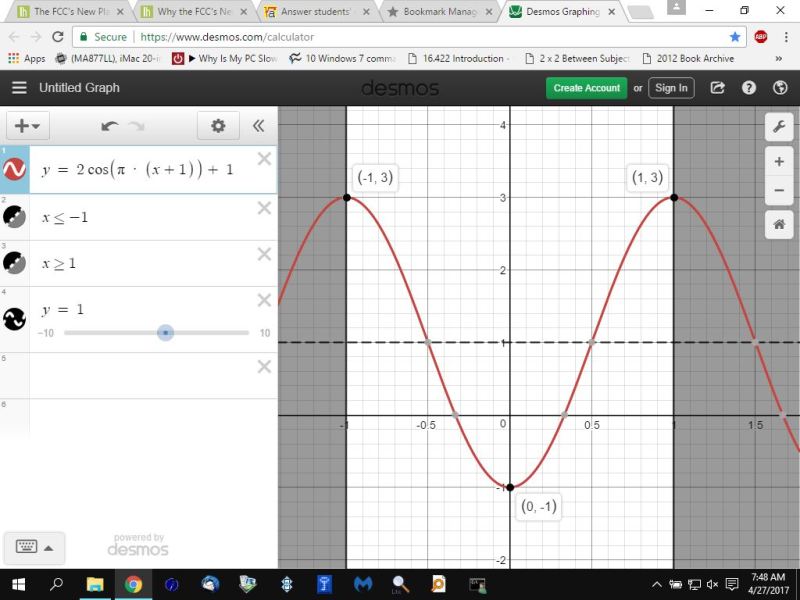
the fourth graph is your solution.
that looks like your selection d.
note that:
frequency is equal to 2pi / period.
since the frequency of your first graph is pi radians, then the period is 2pi/pi = 2 radians.
you get one complete cycle of the cosine wave in 2 radians as shown on the graph.
in the first graph:
the horizontal range goes from x = 0 to x = 2
the center line is y = -2
the vertical range goes from y = -1 to y = -3
in the second graph:
the horizontal range remains at x = 0 to x = 2
the center line moves up 3 units to y = 1
the vertical range becomes y = 2 to y = 0
this is because the graph has been shifted up 3 units.
in the third graph:
the horizontal range becomes x = -1 to x = 1
the center line remains at y = 1
the vertical range remains at y = 2 to y = 0
this is because the graph has been shifted to the left 1 unit.
in the fourth graph:
the horizontal range remains at x = -1 to x = 1
the center line remains at y = 1
the vertical range becomes y = 3 to y = -1
this is because the vertical range has been multiplied by a factor of 2.
here's a reference that looks pretty complete.
http://www.mathguide.com/lessons2/GraphingTrig.html