SOLUTION: Help please!!
Find the equation of the line of best fit from the data in the table. Round the slope and the y-intercept to the nearest hundredth.
x 12 14 16 18 20
__________
Algebra ->
Systems-of-equations
-> SOLUTION: Help please!!
Find the equation of the line of best fit from the data in the table. Round the slope and the y-intercept to the nearest hundredth.
x 12 14 16 18 20
__________
Log On
Question 590332: Help please!!
Find the equation of the line of best fit from the data in the table. Round the slope and the y-intercept to the nearest hundredth.
x 12 14 16 18 20
________________
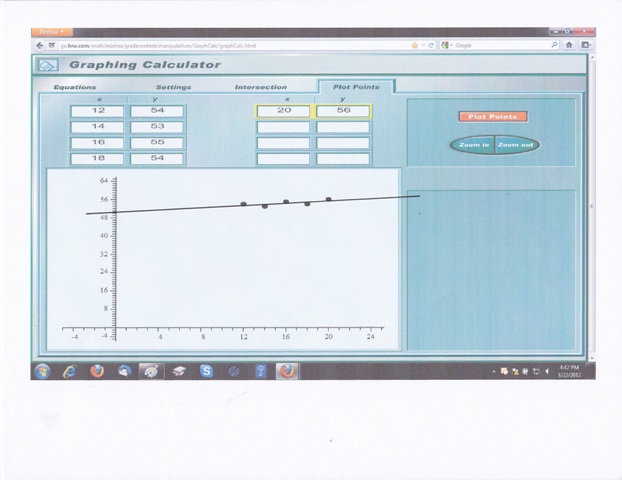
y 54 53 55 54 56 Answer by Theo(13342) (Show Source):
You can put this solution on YOUR website! you can try to find the line manually or you can use a calculator, like the TI-83 or TI-84 or even the TI-30X-IIS
I used the TI-30X-IIS for this problem.
The calculator told me that the equation for the best fit of this data is:
y = .25x + 50.4
the correlation factor is .693375245 which is a pretty good positive fit.
correlation factor of 1 would be a perfect positive fit.
correlation factor of -1 would be a perfect negative fit.
correlation factor of 0 would be the worst fit (neither negative or positive correlation can be derived).
a table of your data and the derived data from the calculator generated best fit equation is shown below:
x         y         calculator best fit y      manual best fit y
12       54                 53.4
14       53                 53.9
16       55                 54.4
18       54                 54.9
20       56                 55.4
a picture of your data points and a straight line best fit that i did using the eyeball method gave a pretty close approximation of what the calculator did for me.
you can also manually calculate the best fit linear equation using the method in the following link. http://www.statisticshowto.com/articles/how-to-find-a-linear-regression-equation/
that, however, is doing it the hard way and definitely not recommended unless you absolutely are required to do so.
calculators are so much easier.
it's a good learning tool, however, for you to appreciate how the calculator does it