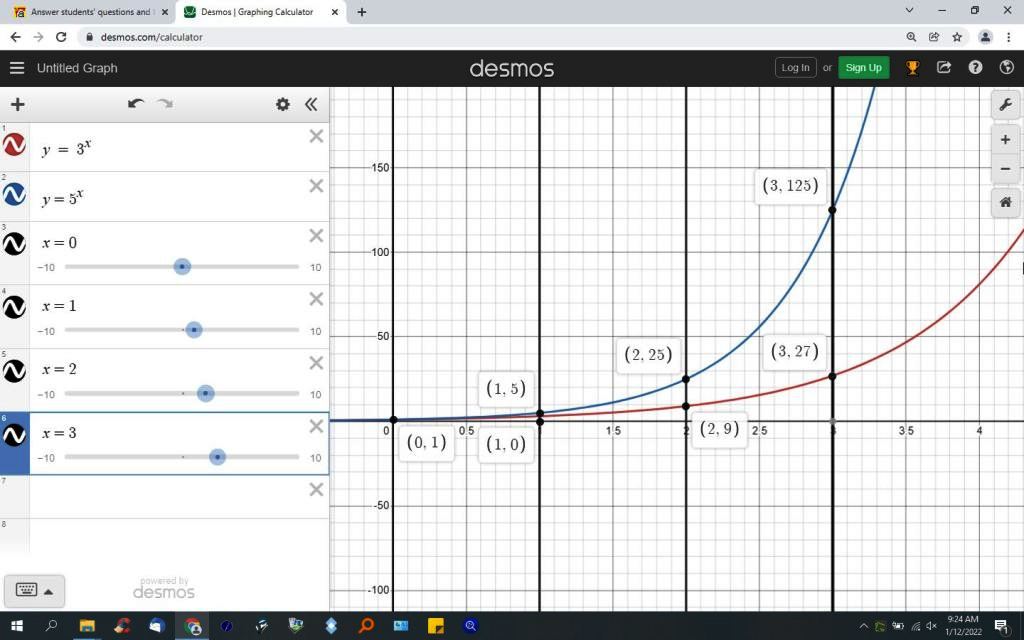
whehn x = 0, h(x) and k(x) both equal 1.
in the graph, h(x) is equal to y and k(x) is equal to y.
this is done for graphing purposes.
the coordinates are in (x,y) format.
x is the value of the coordinate point along the x-axis.
y is the value of the coordinate point along the y-axis.
a table of values can be created as shown below;
x            h(x) = 3^x        k(x) = 5^x

0                1                 1
1                3                 5
2                9                 25
3                27                125
not shown on the graph are the values when x is negaive.
as the value of x becomes more negative, both equations will get closer to 0, but will never be equal to 0.
this is because 1 divided by any positive number can never be equal to 0, no matter how large that positive number is.